
Ethereum is struggling to stay above the $2,000 level as the broader cryptocurrency market enters a more vulnerable phase due to continued selling pressure, weakening momentum, and increasing uncertainty. Despite several rebound attempts in recent weeks, price action has remained muted as liquidity conditions tighten and investor sentiment becomes increasingly cautious. The inability to secure sustained acceptance above this psychological threshold has reinforced the perception that the market is still navigating a correction environment rather than transitioning into a clear recovery phase.
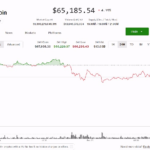
A recent CryptoQuant report provides additional context by highlighting the rapid increase in exchange activity. According to the data, total Ethereum inflows into Binance over the past 30 days reached approximately $33.3 billion, the highest since November last year. The surge comes as ETH is trading near $1,955 after a gradual but sustained decline in recent weeks.
Historically, increased inflows to major exchanges tend to indicate an increased supply of tradable assets. Once a significant amount of Ethereum moves to a platform like Binance, it can be used for spot sales, derivatives collateral, or portfolio rebalancing. As a result, this surge in inflows is a sign of heightened market activity and potentially increased near-term volatility.
While the recent surge in Ethereum inflows to Binance may initially appear bearish, the report emphasizes that this should not automatically be interpreted as a negative signal. Increased exchange inflows can sometimes reflect strategic repositioning rather than immediate sales intentions. Investors may be prepared to trade actively, hedge exposures or adjust portfolio allocations, especially during periods of heightened volatility when access to liquidity becomes more important.

In addition, strong inflow phases sometimes preceded periods of price stabilization. If the additional supply flowing into exchanges is met by sufficient demand, the market may shift towards consolidation rather than further declines. These dynamics often depend on broader liquidity conditions, derivatives positioning and macro sentiment rather than the inflows themselves.
In other words, recording the highest inflow level since last November puts Ethereum in a structurally sensitive phase. The market’s reaction to these trends will provide clearer directional signals in the coming weeks. If the added supply translates into continued sell-side pressure, downside risks could continue to rise. Conversely, if demand absorbs this liquidity effectively, the current phase may represent a redistribution ahead of a more constructive move rather than continued weakness.
Ethereum’s weekly chart reflects a structurally weak environment as the price continues to trade below the $2,000 psychological threshold. ETH established a sequence of highs and lows after failing to maintain momentum above its mid-2025 highs near $4,800. This is a classic downtrend formation that indicates a continuous distribution rather than a consolidation.

Technically, Ethereum is positioned below key moving averages that previously served as dynamic support during the rally phase. These averages have rolled over and now function as resistance zones, limiting recovery attempts unless they are decisively pulled back. The recent rejection near $3,000 has strengthened this bearish turn, accelerating the downward momentum towards the current ~$1,900 region.
Volume trends show a decline in participation compared to the expansion phase, suggesting a decline in speculative enthusiasm. However, once selling pressure is exhausted, the decline in volume during a correction can sometimes outpace stabilization.
From a structural perspective, immediate support appears near the $1,800-$1,900 range where previous consolidation occurred. A sustained breakout below this zone could expose a deeper retracement level to the historical accumulation zone. Conversely, a return to the heavily traded $2,200-$2,400 region is needed to shift near-term momentum back to a neutral or constructive bias.
Featured image from ChatGPT, chart from TradingView.com
editing process for focuses on providing thoroughly researched, accurate, and unbiased content. We adhere to strict sourcing standards and each page undergoes diligent review by our team of top technology experts and seasoned editors. This process ensures the integrity, relevance, and value of the content for readers.