
Ethereum is testing a major support level after the U.S. spot Ethereum exchange-traded fund reported its first net outflow in more than a week, ending an eight-day streak of inflows.
summary
- After the ETF outflow, Ethereum price tests the $4,300 support.
- Spot ETH ETF is seeing its first withdrawal in 9 days.
- Traders are expecting a rebound towards $4,600 if the support holds.
At the time of writing, Ethereum was trading at $4,352, down 2.3% from the previous day and 3.2% this week. The asset remains about 12% below its Aug. 24 peak of $4,946.
Spot trading activity remained strong, with trading volume of $40.4 billion in the past 24 hours, an increase of 9% from the previous day. Derivatives data from CoinGlass showed a mixed setup.
Ethereum (ETH) futures trading volume increased by 21.5% to $93.6 billion, while open interest decreased by 0.83% to $59.2 billion, suggesting traders are taking partial profits while holding positions.
Spot ETH ETF outflows signal temporary cessation of institutional demand
According to data from SoSoValue, the US Spot Ethereum ETF recorded net outflows of $8.54 million on October 9, ending steady inflows. BlackRock’s ETHA ETF still recorded $39.29 million in new inflows, but withdrawals from Fidelity ($30.26 million) and Bitwise ($8.07 million) made the total negative.
You may also like: Ethereum Foundation Expands Privacy Commitment with New “Privacy Cluster” Initiative
The change comes as investors returned to Bitcoin (BTC), receiving nearly $198 million in inflows on the same day. Despite this pause, the Ethereum ETF has seen strong interest from institutional investors, with net inflows exceeding $1.3 billion in the first week of October.
Analysts believe the short-term outflows are part of normal ETF rotation after a huge buildup at the beginning of the month. They expect momentum to return as key catalysts approach, including BlackRock’s staking ETF decision, expected by the end of October, and upcoming U.S. Consumer Price Index data that could impact risk appetite.
Ethereum price technical analysis
Ethereum’s technical setup indicates that the market is strengthening, not declining. The relative strength index is neutral at 49, indicating balanced pressure between buyers and sellers. The MACD and momentum indicators remain positive, indicating that the underlying trend remains intact despite the recent pullback.
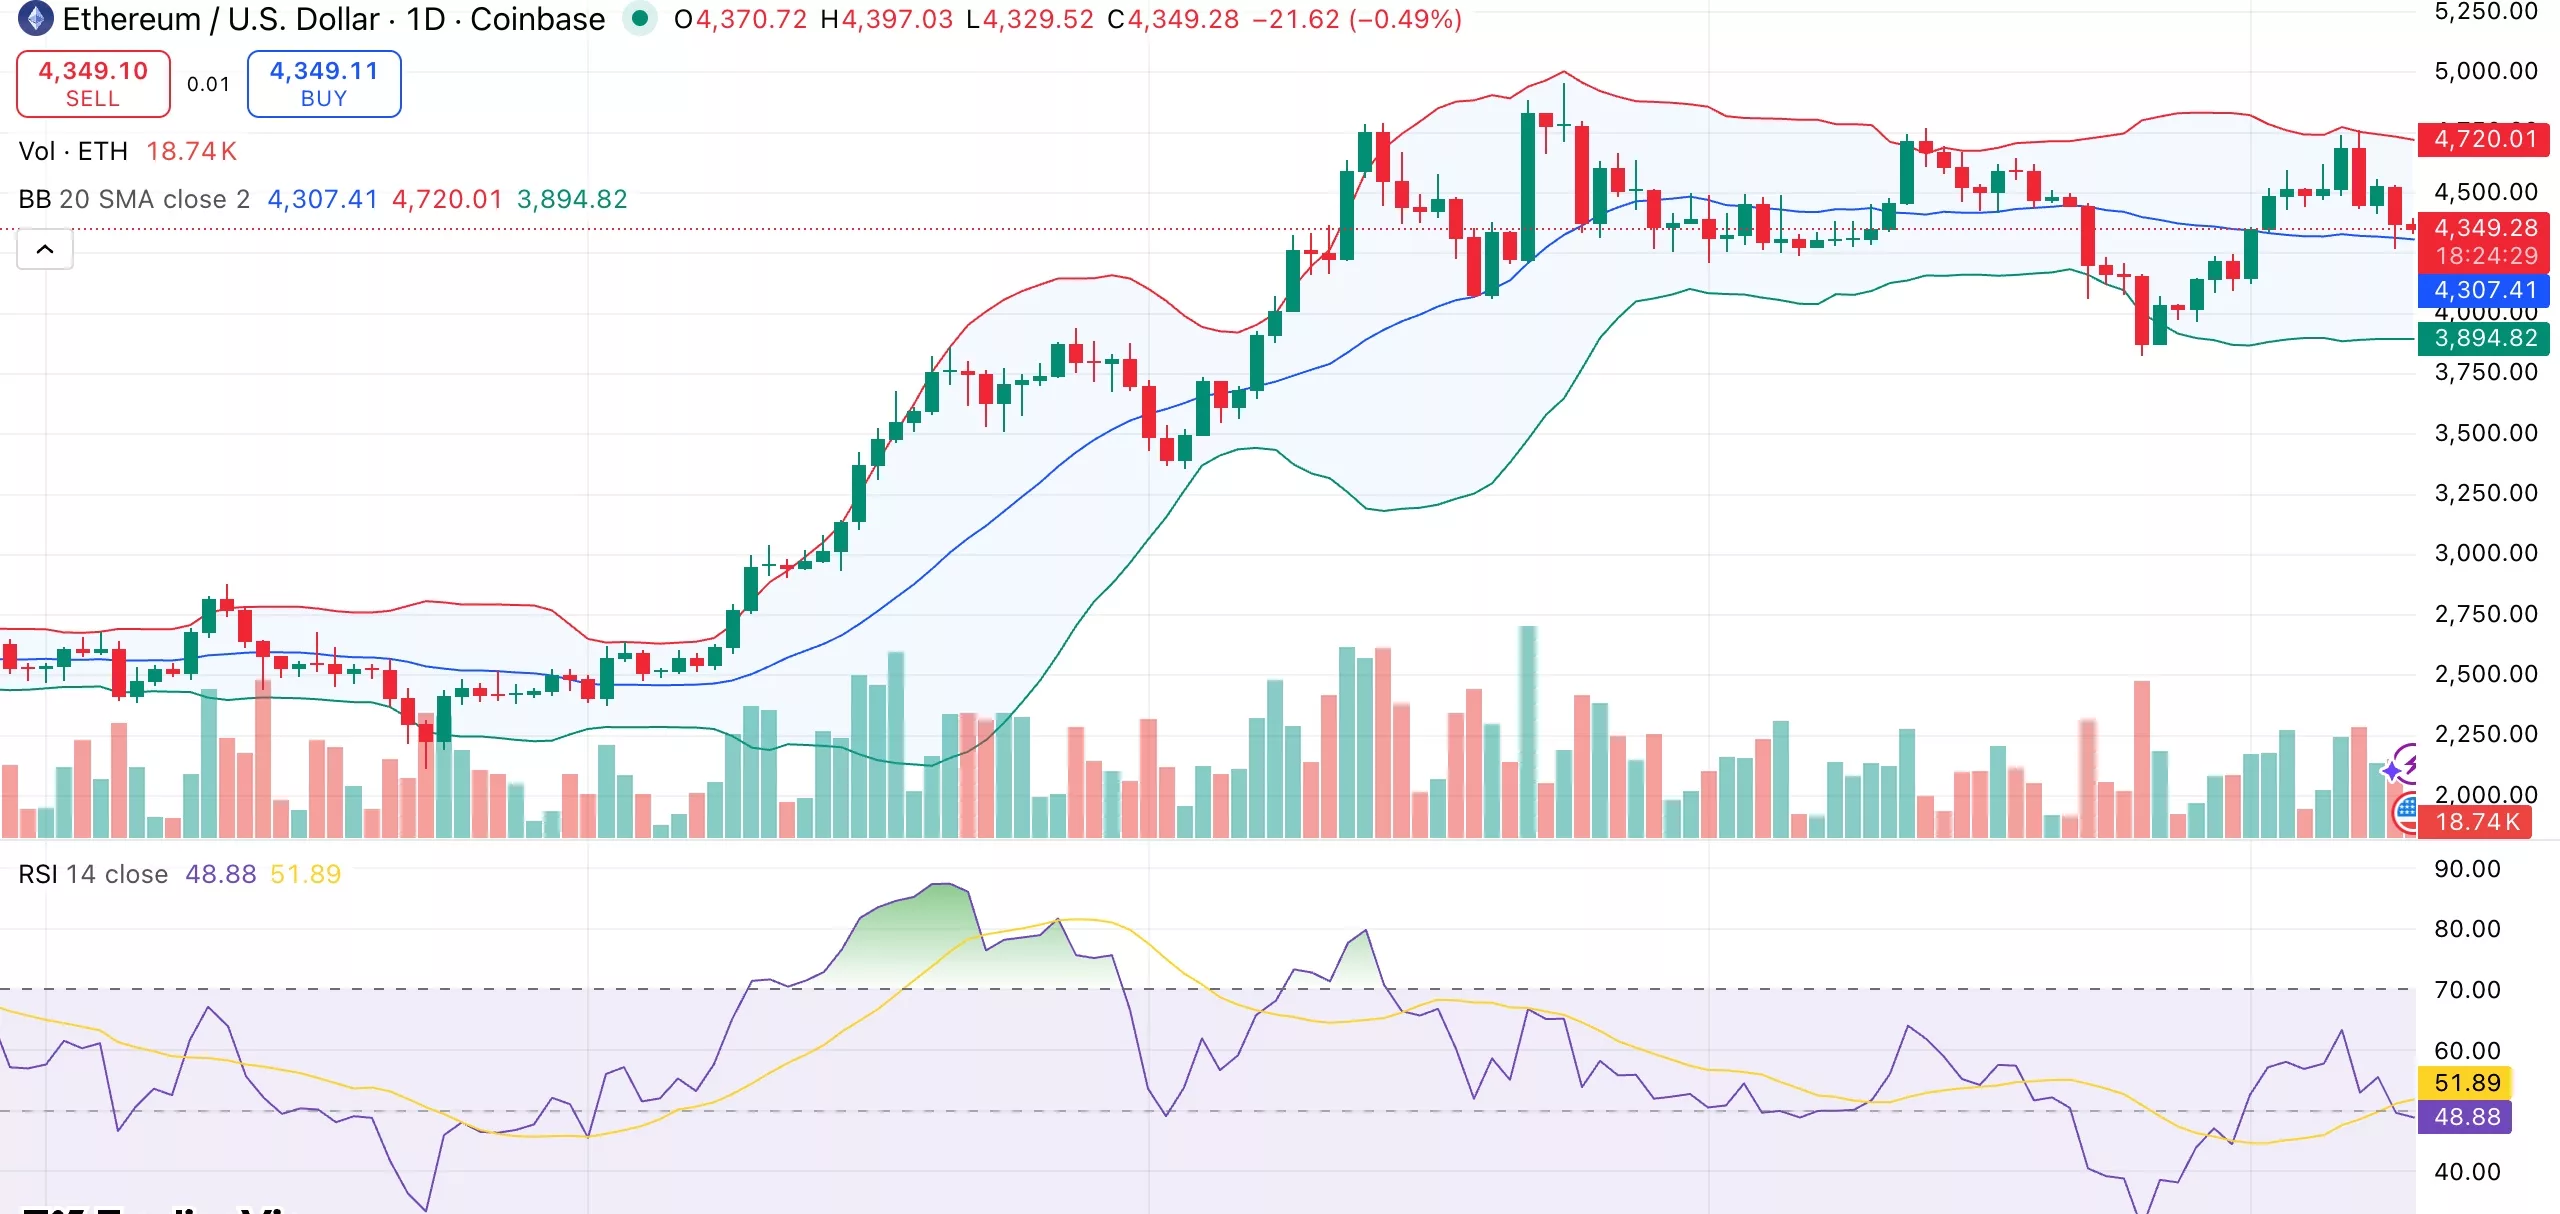
Ethereum daily chart. Credit: crypto.news
ETH is currently trading slightly below its 10-day and 20-day moving averages around $4,450, but the long-term 50-day and 100-day averages continue to rise, forming a support zone between $4,000 and $4,300. This means the current decline may be part of a larger correction phase ahead of further gains.
Traders are expecting a rally towards the $4,600 resistance level if the $4,300 support level holds. A break above this range could open the door to $4,950-$5,000, while a break below could lead to a retest of the next key support at $3,900.
read more: Ethereum News: Bit Digital expands ETH holdings with $150 million offering