Ethereum is currently below the $3,200 milestone after failing to maintain its 100-day moving average. On-chain supply dynamics remain interesting despite the broad downward trend over the past few weeks. But technically speaking, buyers are rapidly losing ground as momentum shifts further in sellers’ favor.
technical analysis
Written by Shayan
daily chart
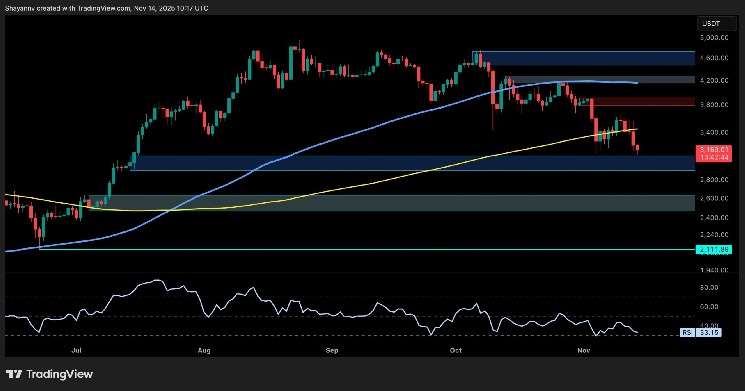
On the daily time frame, ETH remains just above the key support zone around $3,000. The price has fallen below the $3,800 level and the 100-day moving average located around $3,400, with both levels turning into resistance. The 200-day moving average is also now gradually tilting, reflecting the weakening of the medium-term trend.
The RSI has also dropped to around 33, indicating bearish momentum, but ETH is also approaching oversold territory. If the asset cannot sustain above $3,000, the next major support will be around the $2,500 zone, which also aligns with the previous demand area at the beginning of Q3. If buyers want to regain control, they will need to retake $3,800 on strong volume and reverse the 100-day and 200-day moving averages again.

4 hour chart
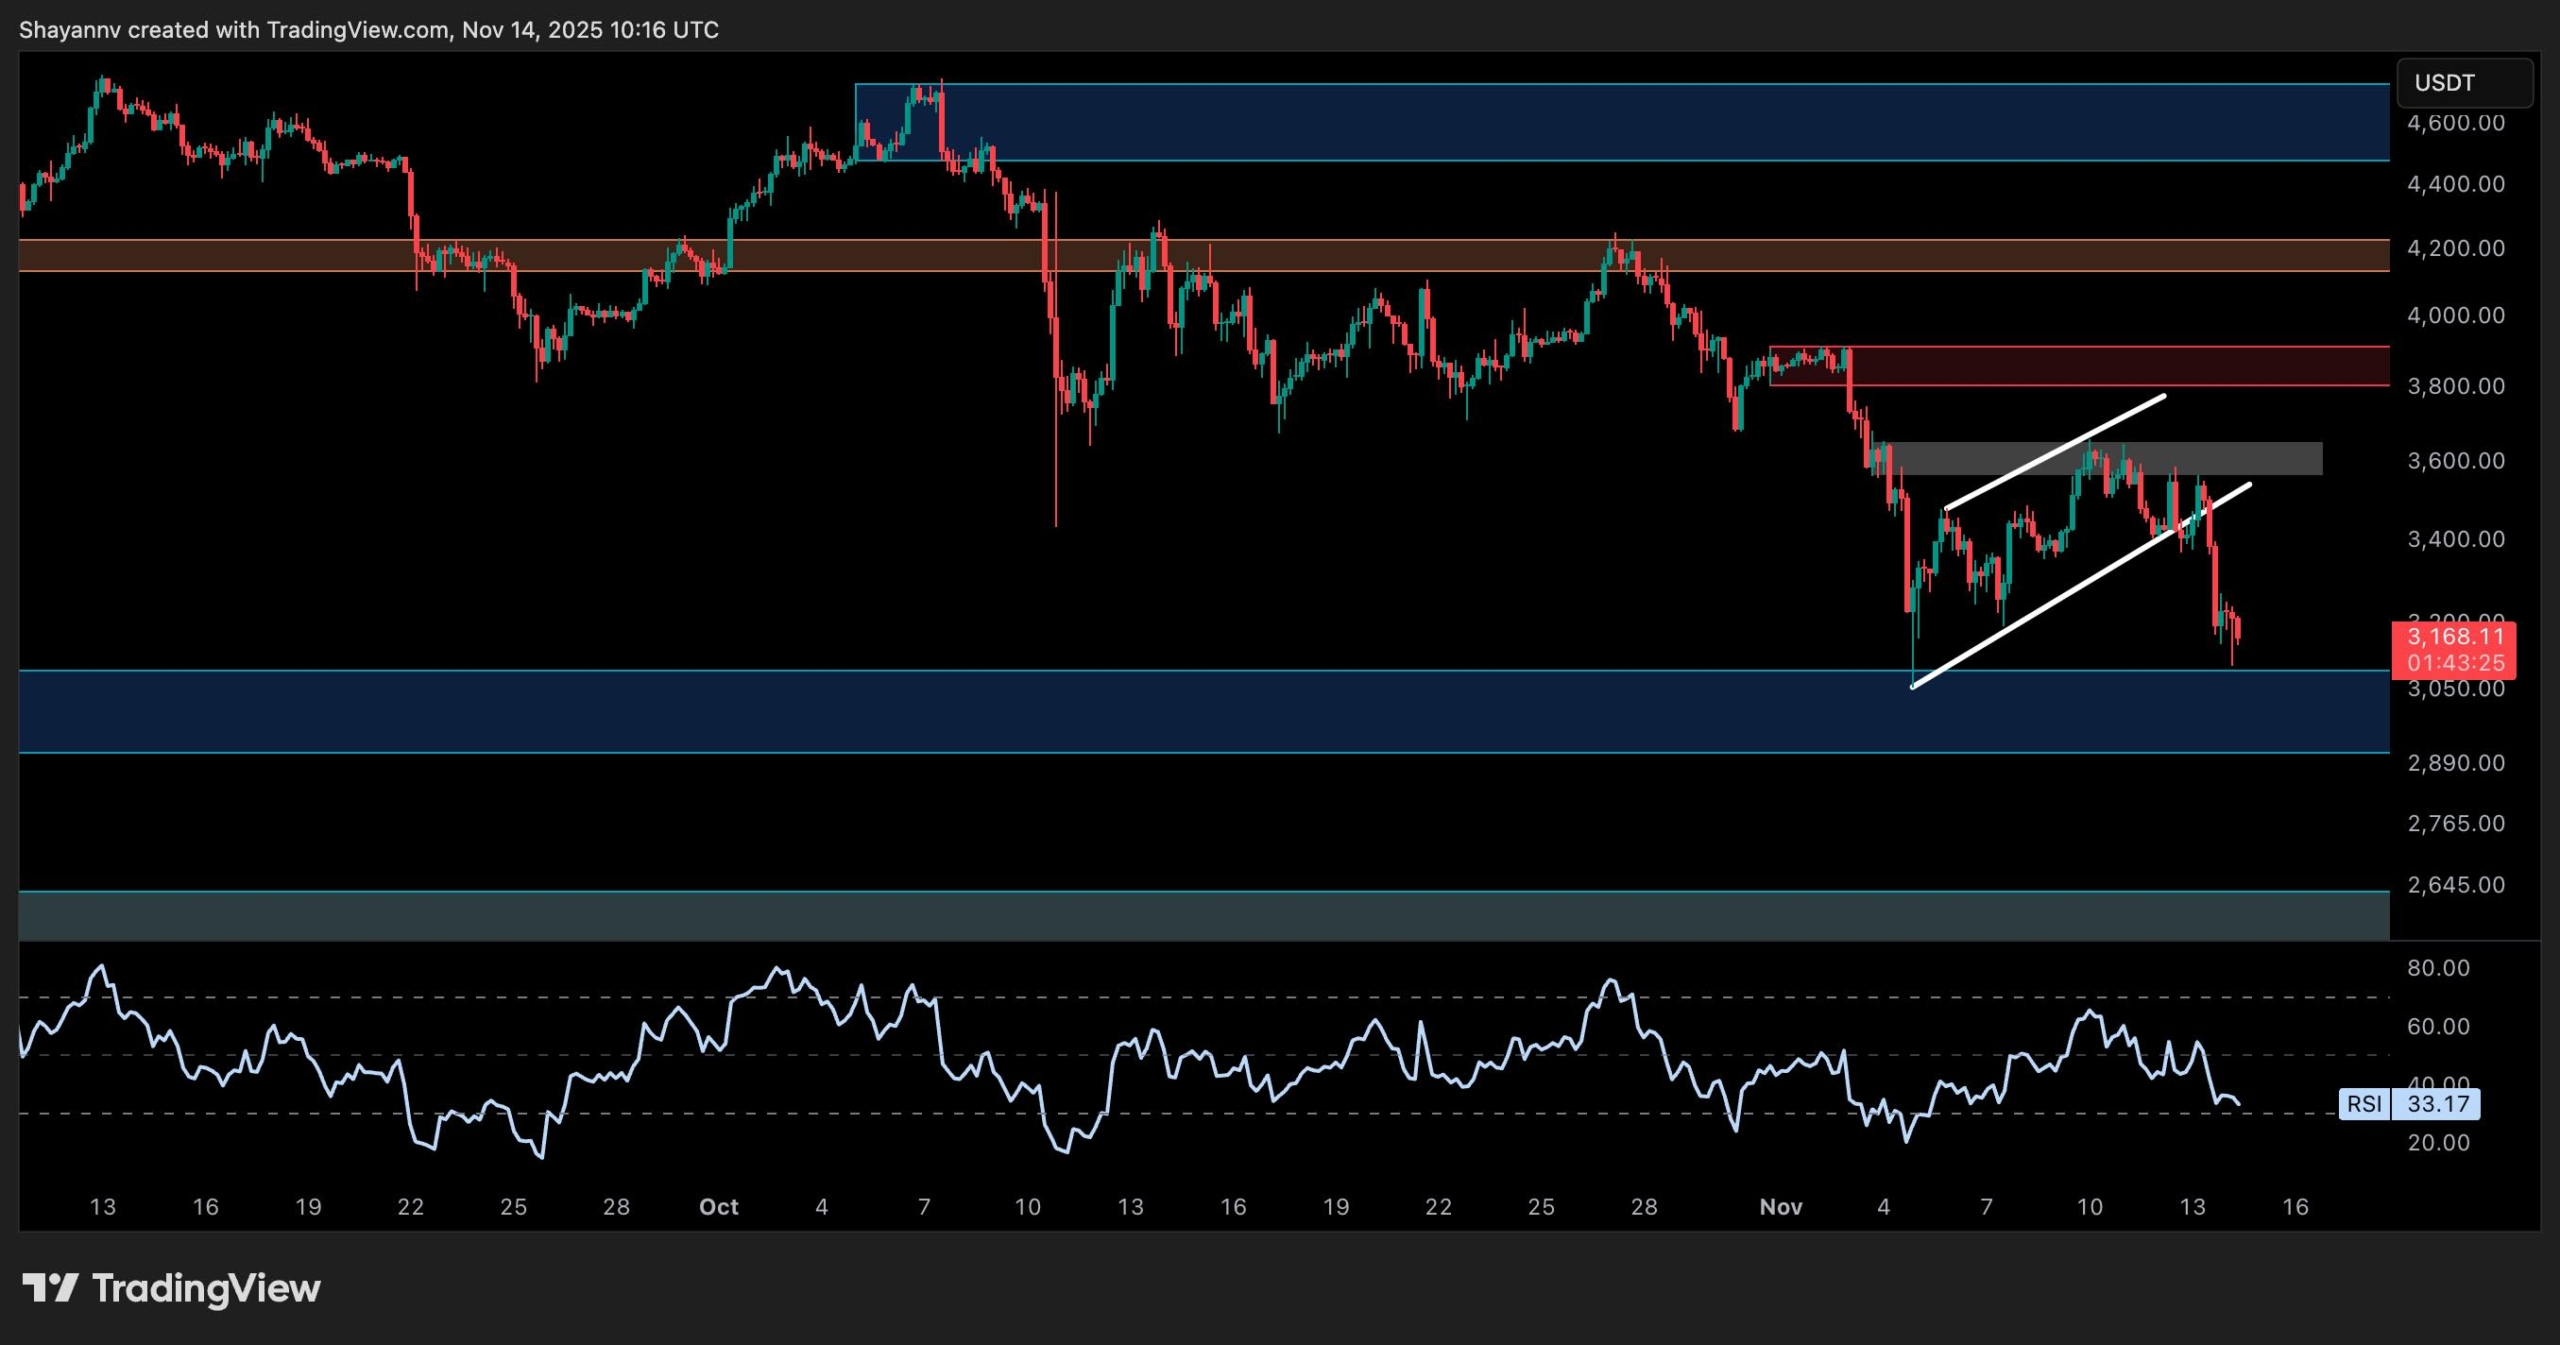
On the 4-hour chart, ETH broke the bearish flag to the downside, confirming its continued decline. After failing to reclaim the $3,600 resistance area, the price sold off heavily and is now testing the $3,000 demand zone. The structure remains bearish, with clear highs and lows forming since early October.
Momentum remains weak. The RSI is still hovering around 33 on this time frame, indicating the possibility of further decline. If the $3,000 support zone breaks, the next important level to look at will be the $2,600 area. A short-term pullback towards $3,300 or even $3,400 could simply provide a selling opportunity unless there is a spike in volume or a clean break through the $3,800 resistance zone.
On-chain analysis
exchange reserves
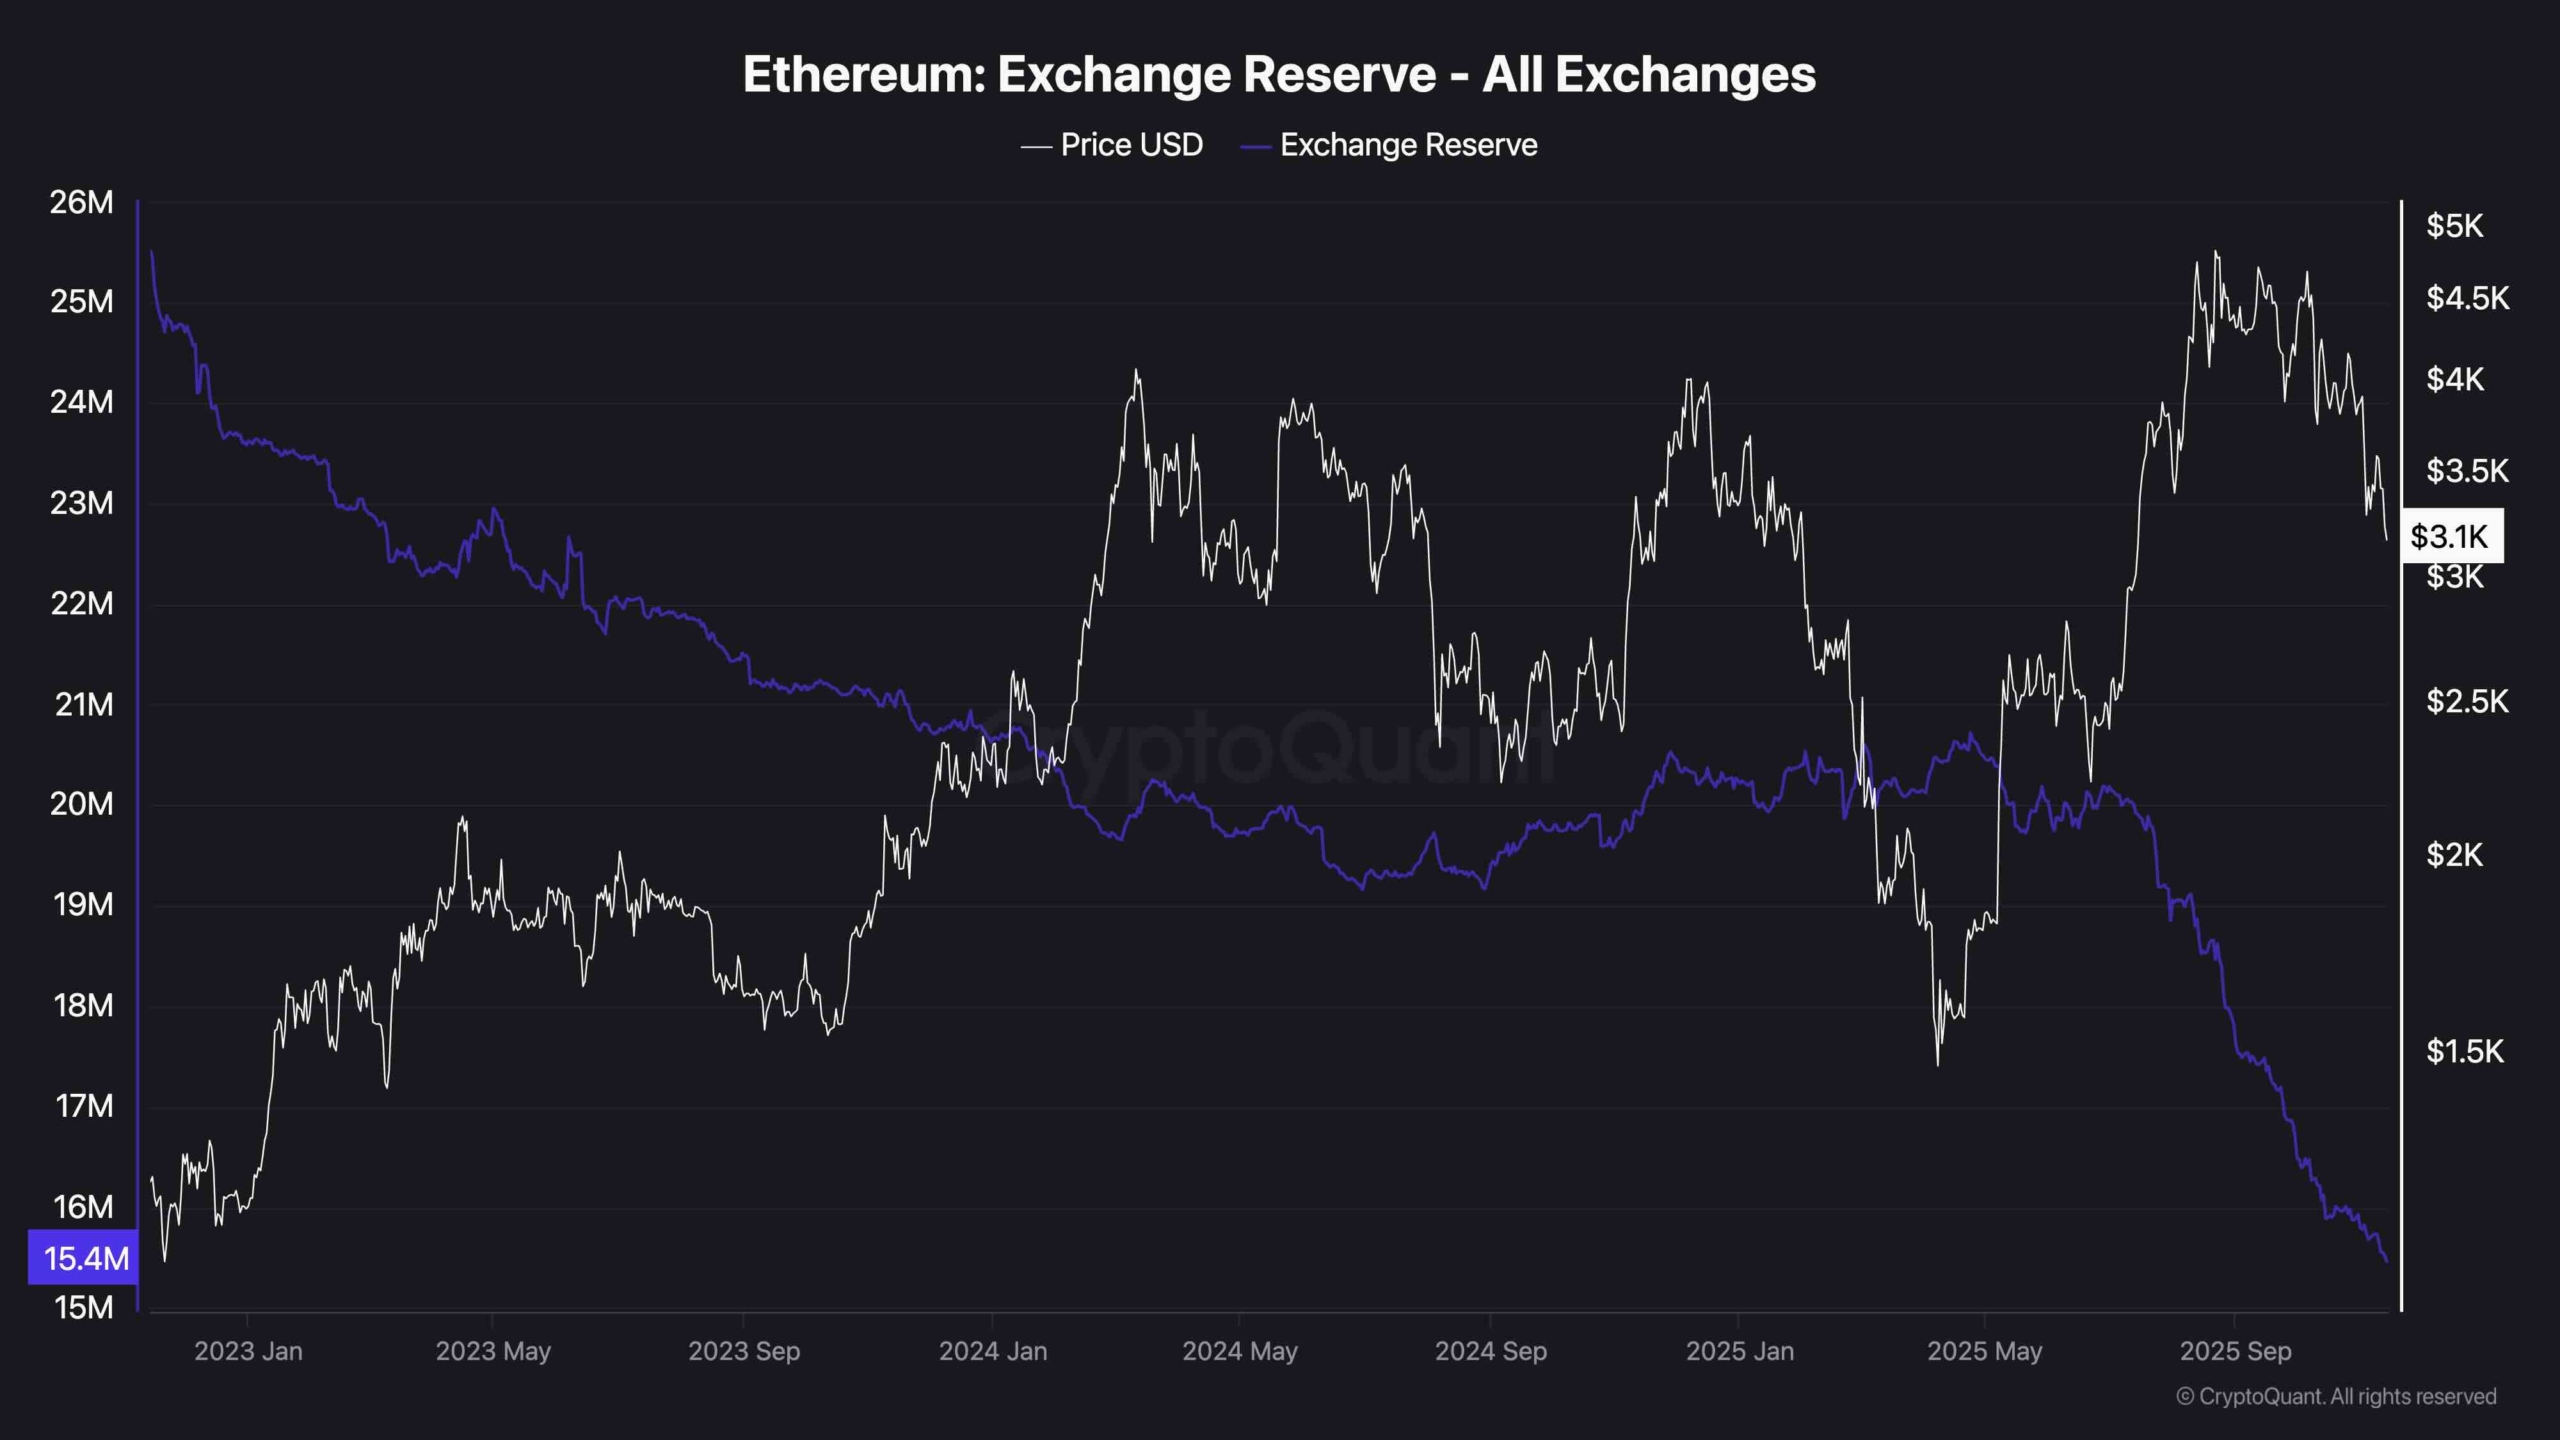
Ethereum’s exchange reserves continue to decline and are currently at multi-year lows. Just over 15 million ETH is being held on centralized exchanges, which is a structurally bullish sign in the long term and indicates that the trend of accumulation and self-custody continues.
However, despite this bullish supply trend, recent price movements indicate that demand is not strong enough to absorb the current spot selling. In other words, supply is low but buyers are not intervening aggressively enough to allow a correction like the one we are currently witnessing. Until demand recovers meaningfully, prices may remain under pressure even with positive on-chain flows.