
Ethereum price breaks through key support level of $3,000
$Ethereum is officially fell below the psychological $3,000 levela major support that has been holding the price up for several weeks.
This failure occurs after a few hours Bitcoin falls below $92,000causing a market-wide decline, with all major cryptocurrencies dropping significantly.
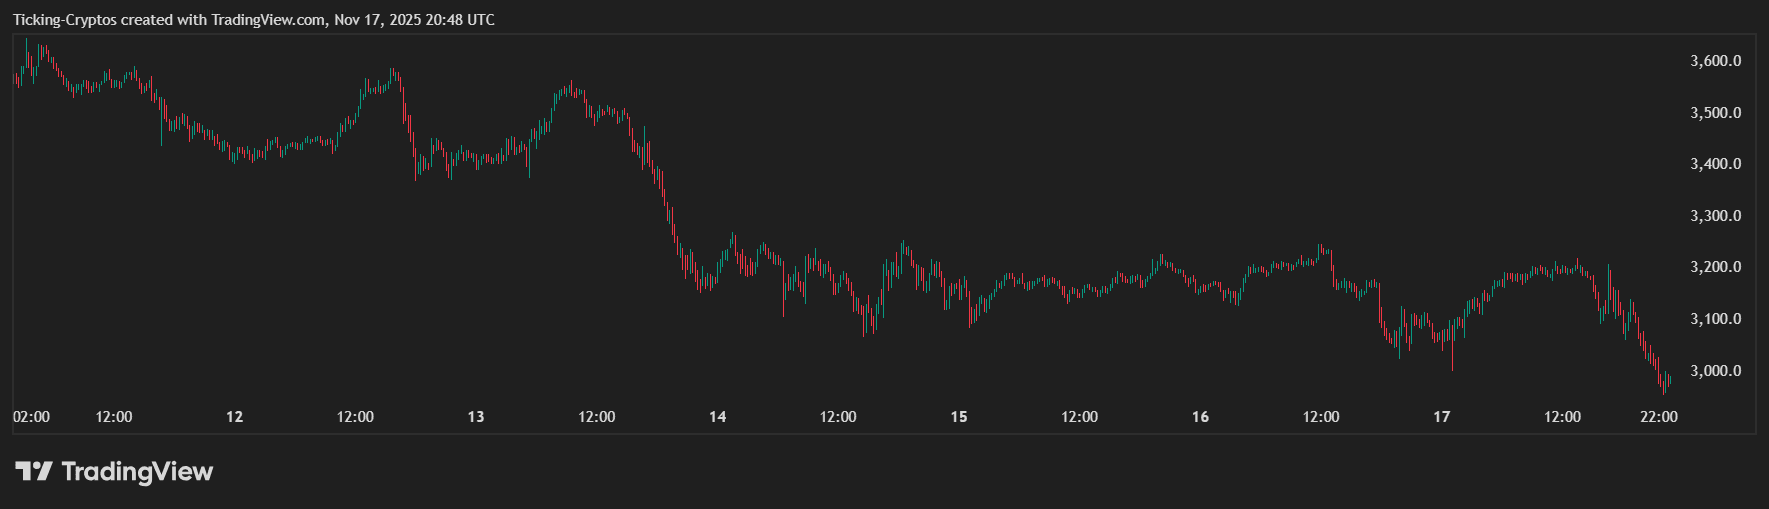
Ethereum price in USD over the past week – TradingView
ETH is now entering dangerous territory, and the $3,000 loss indicates that the broader trend is consolidating and shifting back to bearish momentum.
Ethereum Crash Analysis: Rejection at $3,200 Confirms Bearish Structure
The chart below highlights some key technical signals.
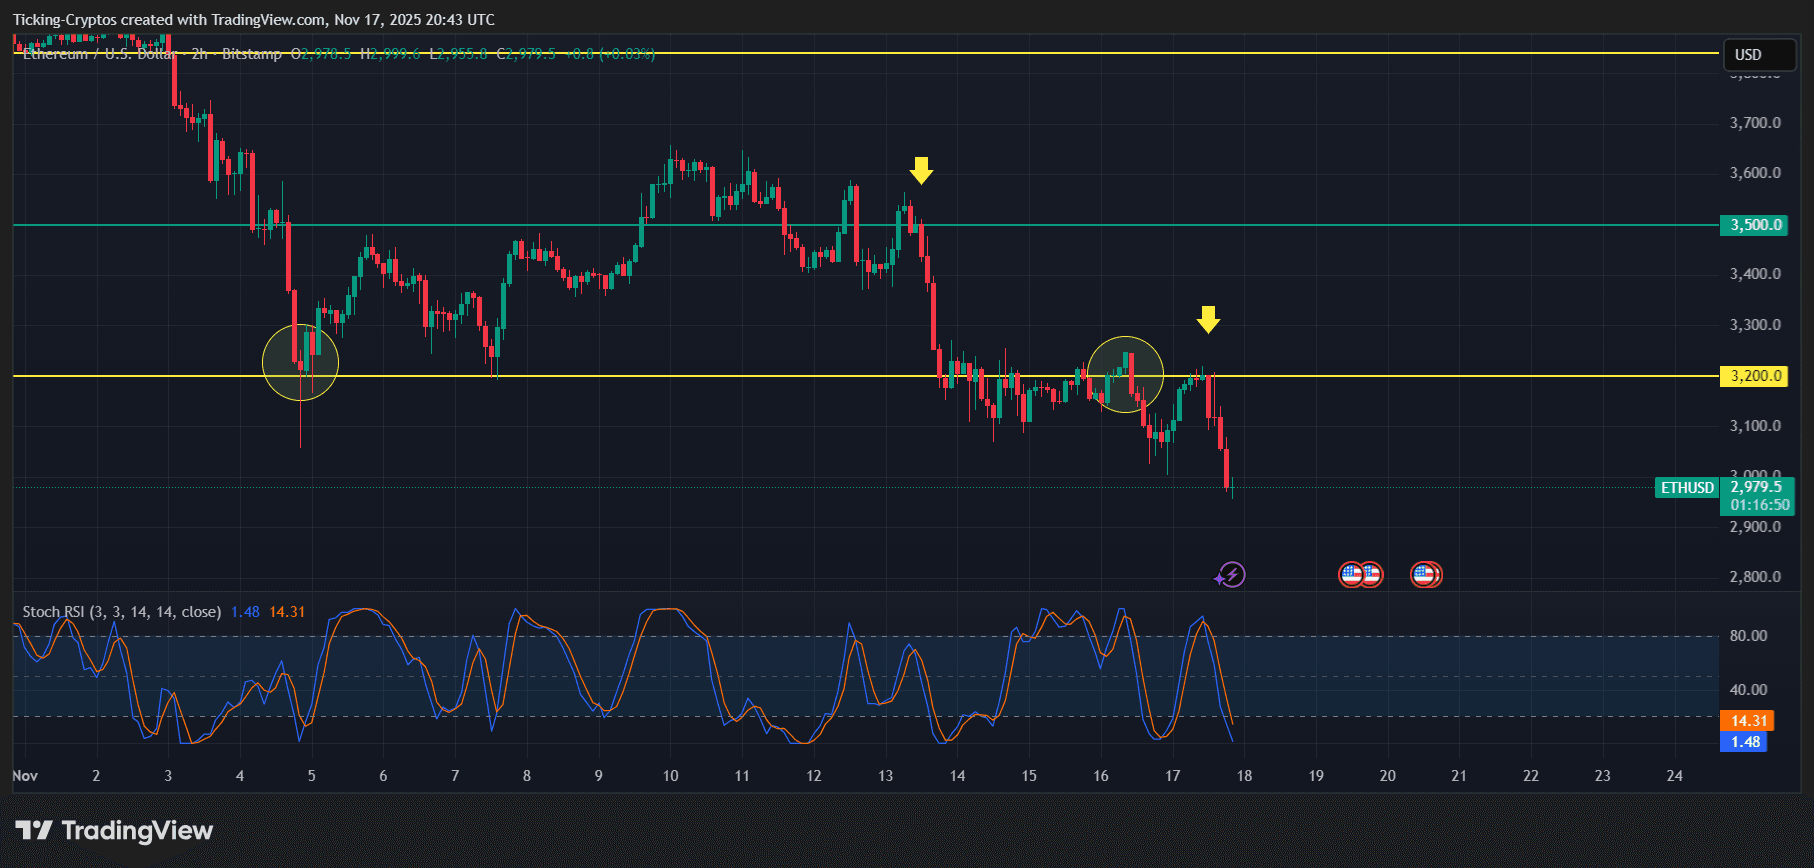
ETH/USD 2 hour chart – TradingView
1. $3,200 zone tested twice and rejected
The yellow zone is $3,200 It served as the main resistance.
- of first refusal Occurs after a short-term rebound (yellow arrow on the left)
- of second refusal It happened recently, but again a clear decline was recorded (yellow arrow on the right)
Sellers actively intervened every time ETH reached $3,200.
2. Fraud of around $3,200 triggered the breakdown.
Both circled areas show that ETH briefly rose above the level, but quickly fell back.
like that fake pimples This is typical in bear markets and often leads to sharp declines.
3. Panic drop after Bitcoin loses 92,000 mark
The last candlestick shows heavy red momentum just after Bitcoin broke out.
- First $95,000
- $92,000 soon after.
This created further selling pressure on ETH, causing the price to plummet to $3,000.
4. Stochastic RSI is resetting to lows — further downside possible
Bottom Stoch RSI:
- Indicates movement from midrange back to. oversold
- indicates downward momentum again
An oversold range often results in a pullback, but in a crash environment the indicator continue to be oversold for a long period of time.
Why this drop matters
Ethereum has officially lost an important psychological level
$3,000 is not just technical support; Key psychological thresholds.
Below that, the next signal is sent.
- weaken confidence
- panic increases
- Liquidity on the buy side is weak
Bitcoin crash forces ETH to fall
As seen before:
Total market loss in 24 hours:
- $ETH: -3.55%
- $XRP: -3.83%
- $SOL: -5.21%
- $ADA: -4.55%
Ethereum followed the broader market, accelerating its decline as BTC fell out of support.
Next possible Ethereum target
Based on the chart structure, it looks like this:
1. $2,900 — Current zone
ETH is trying to stabilize around this area, but volume is weak.
2. $2,800 — stronger historical support
this is, Next major floor You can look at longer time frames.
Many traders will be monitoring this level closely.
3. $2,600-$2,700 range — if panic accelerates
If Bitcoin continues to fall in the following directions:
- $90,000,
- Even worse, $88,000 – $86,000
ETH could return to the mid-$2,600 region soon.
Will Ethereum recover soon?
Short answer: It won’t work unless Bitcoin becomes stable.
Ethereum’s structure is currently bearish. Here’s why:
- $3,200 declined twice
- The $3,000 was split cleanly.
- Momentum oscillator decline
- Bitcoin’s advantage rises during decline
A recovery is possible, but only if BTC forms a solid foundation on top. $92,000 Again, it remains uncertain.