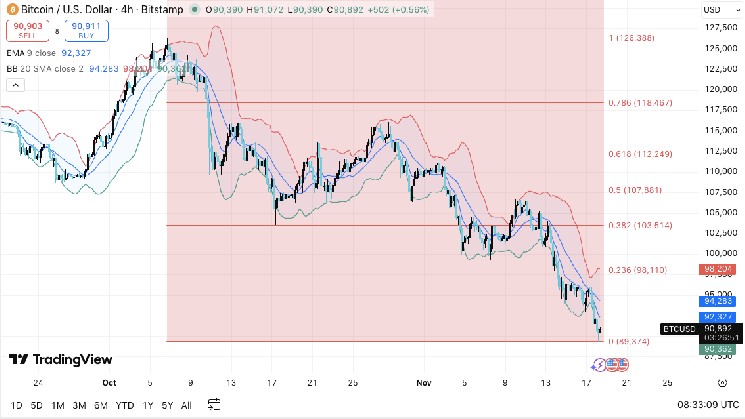
Bitcoin has continued to fall since the beginning of this week as selling pressure intensified across spot and derivatives markets. Price movement on the 4-hour chart shows the asset moving steadily along the lower bound of the Bollinger Band and trading well below the 9-EMA.
This structure ensures that the seller is in complete control. In addition, broader market trends, including new outflows and large transfers related to Mt Gox, are adding new uncertainties. These composite signals present a difficult backdrop as Bitcoin tests significant support near the $89,000 zone.
Key technical levels indicate sustained bearish momentum
Bitcoin is trying to maintain the 0% Fibonacci retracement area near $89,374. This level marks the last major support from the recent decline. If the price continues to close below this zone, it opens the door to even bigger losses.
Therefore, the market is closely monitoring this region. Short-term resistance lies at the 9-EMA near $92,327. The next barrier is near the 20-period SMA at $94,283. Price needs to regain these levels before a change in momentum occurs.
Related: XRP Price Prediction: XRP price is at a key turning point as downtrend continues
In addition to this direct cluster, the graph outlines several recovery targets. The 0.236 Fibonacci line is located near $98,110 and could once again attract sellers. The next level is $103,514, which represents the previous consolidation area.

BTC price dynamics (Source: TradingView)
The midpoint of the overall move is at $107,881, and if it is reached, it would indicate a possible change in the trend. The most important threshold remains at the 0.618 level at $112,249. A break above this zone would signal a broader recovery. Until then, Larry will be adjusting and facing pressure.
Derivatives and spot flows reflect rising risk aversion
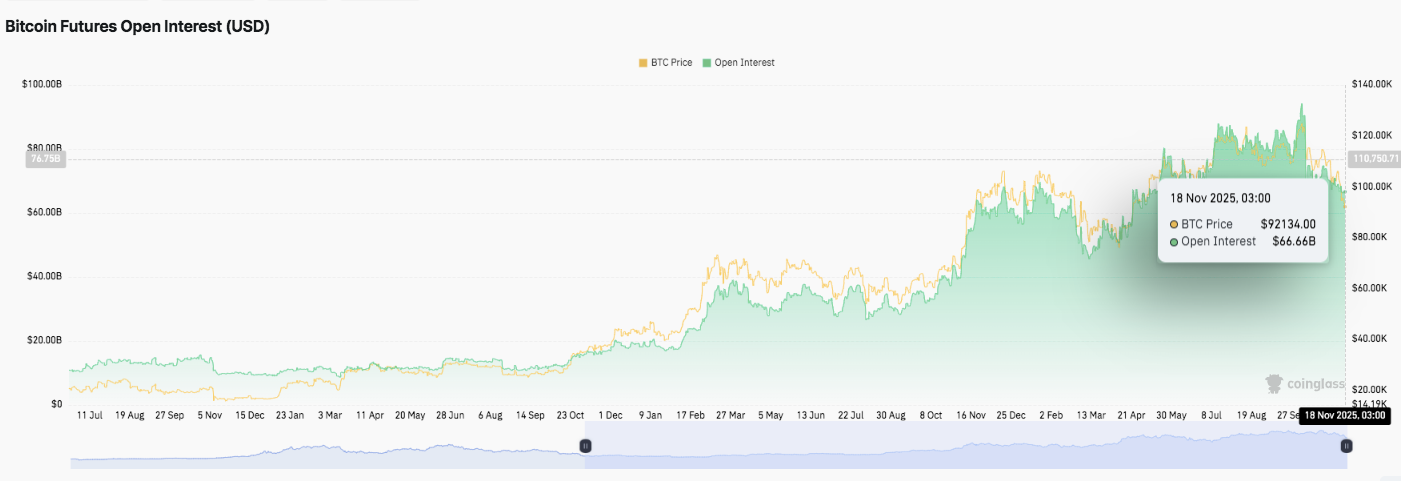
Source: Coinglass
Bitcoin futures open interest decreased to $66.66 billion while the price remained around $92,134. The recent decline from levels above $80 billion suggests traders are reducing leverage exposure during the correction.
Additionally, open interest continues to move with the price, suggesting that both long and short positions are being unwound. Therefore, volatility remains high. If it stabilizes above $90,000, open interest could be rebuilt. However, a further decline in the price leg could trigger further deleveraging.
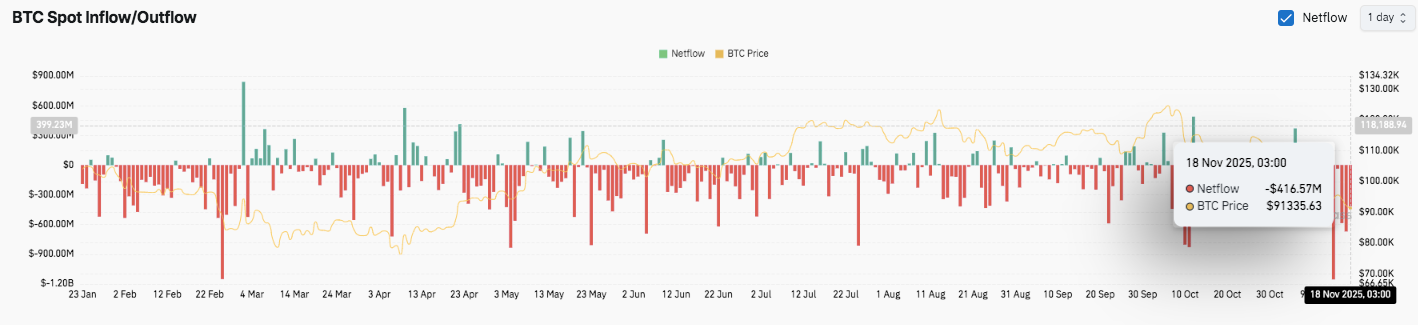
Source: Coinglass
A similar observation can be made with spot flows. Outflows continue to dominate, and frequently large deficits indicate continued selling. The most recent notable outflow of $416.57 million on November 18 coincides with a price decline around $91,335.
Related: Ethereum Price Prediction: Increased Outflows Bring ETH Closer to Major Breakdown Zone
Moreover, inflows remain short-lived and small-scale. As a result, investors continued to reduce their exposure in the third and fourth quarters, indicating increased caution.
Mt Gox transfer raises new uncertainties
Market sentiment worsened further after new transfers linked to Mt Gox. The exchange moved 10,608 BTC worth about $956 million late Monday. The money was sent to two separate addresses. This activity has reignited concerns about additional supply to the market. Additionally, the timing added pressure as Bitcoin trades near multi-week lows.
Technical outlook for Bitcoin price
Key levels remain well-defined as Bitcoin continues to trade within a broader correction structure.
- Top level: $92,327 and $94,283 stand as the first hurdles, followed by $98,110 (0.236 Fib), which is the first major resistance zone that sellers typically re-enter. A stronger recovery could extend to $103,514 (0.382 fib) and $107,881 (0.5 fib).
- Lower price level: Immediate support lies at $89,374 (0% Fibonacci), followed by a deeper pocket of liquidity below the current chart range.
- Upper limit of resistance: $112,249 (0.618 Fibonacci) is the level Bitcoin must recover to confirm medium-term bullish momentum and break out of the broader downtrend structure.
This technical diagram shows BTC rising along the lower bound of the Bollinger Band, forming a series of highs and lows. Prices remain compressed within the descending channel and volatility continues to reduce. This tightening structure often precedes a definitive expansion phase in either direction.
Will Bitcoin rebound?
Bitcoin’s short-term trajectory will depend on whether buyers can defend the $89,374 zone long enough to challenge the $92,327-$94,283 resistance cluster. Technical compression and continued deleveraging suggest volatility could pick up soon. If inflows return and BTC clears $98,110 with confidence, the price could extend to $103,514 and even $107,881 as momentum gains.
However, failure to hold $89,374 risks triggering another wave of declines. This scenario could reveal a zone of low liquidity and accelerate the existing downtrend. For now, Bitcoin is at a pivotal point where market flows, derivative positioning, and recovery of initial resistance levels will determine the next big move.
Related: Dogecoin Price Prediction: Downtrend deepens as DOGE struggles to maintain support
Disclaimer: The information contained in this article is for informational and educational purposes only. This article does not constitute financial advice or advice of any kind. Coin Edition is not responsible for any losses incurred as a result of the use of the content, products, or services mentioned. We encourage our readers to do their due diligence before taking any action related to our company.