Bitcoin’s recent price movement has been melodrama-like, with a roller-coaster decline from a high-priced cameo of $97,939 to a modest flirtation of $88,665 before landing comfortably around $89,396. Despite the dramatic development, the market appears to be catching its breath within a narrow trading band and preparing for the next move. It is not yet confirmed whether they are gearing up for an encore or fading into the break.
Bitcoin chart outlook
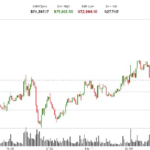
On the daily chart, Bitcoin has been fairly stable in the aftermath of a less than pretty sell-off, dropping from recent highs near $98,000 to lows near $86,000. The mass spill mirrored a panicked exit at a nightclub fire drill. But it’s not all tough. Prices have returned to the $89,000-$90,000 zone, forming what could be an early stage of the base.
Candlesticks indicate indecision and narrowness, as if a crowd is holding their breath in unison. Support lies between $86,000 and $88,000, and while a move above $91,000 may get short-term optimists excited, the real test lies at the upper end of the $94,000 to $95,000 resistance.
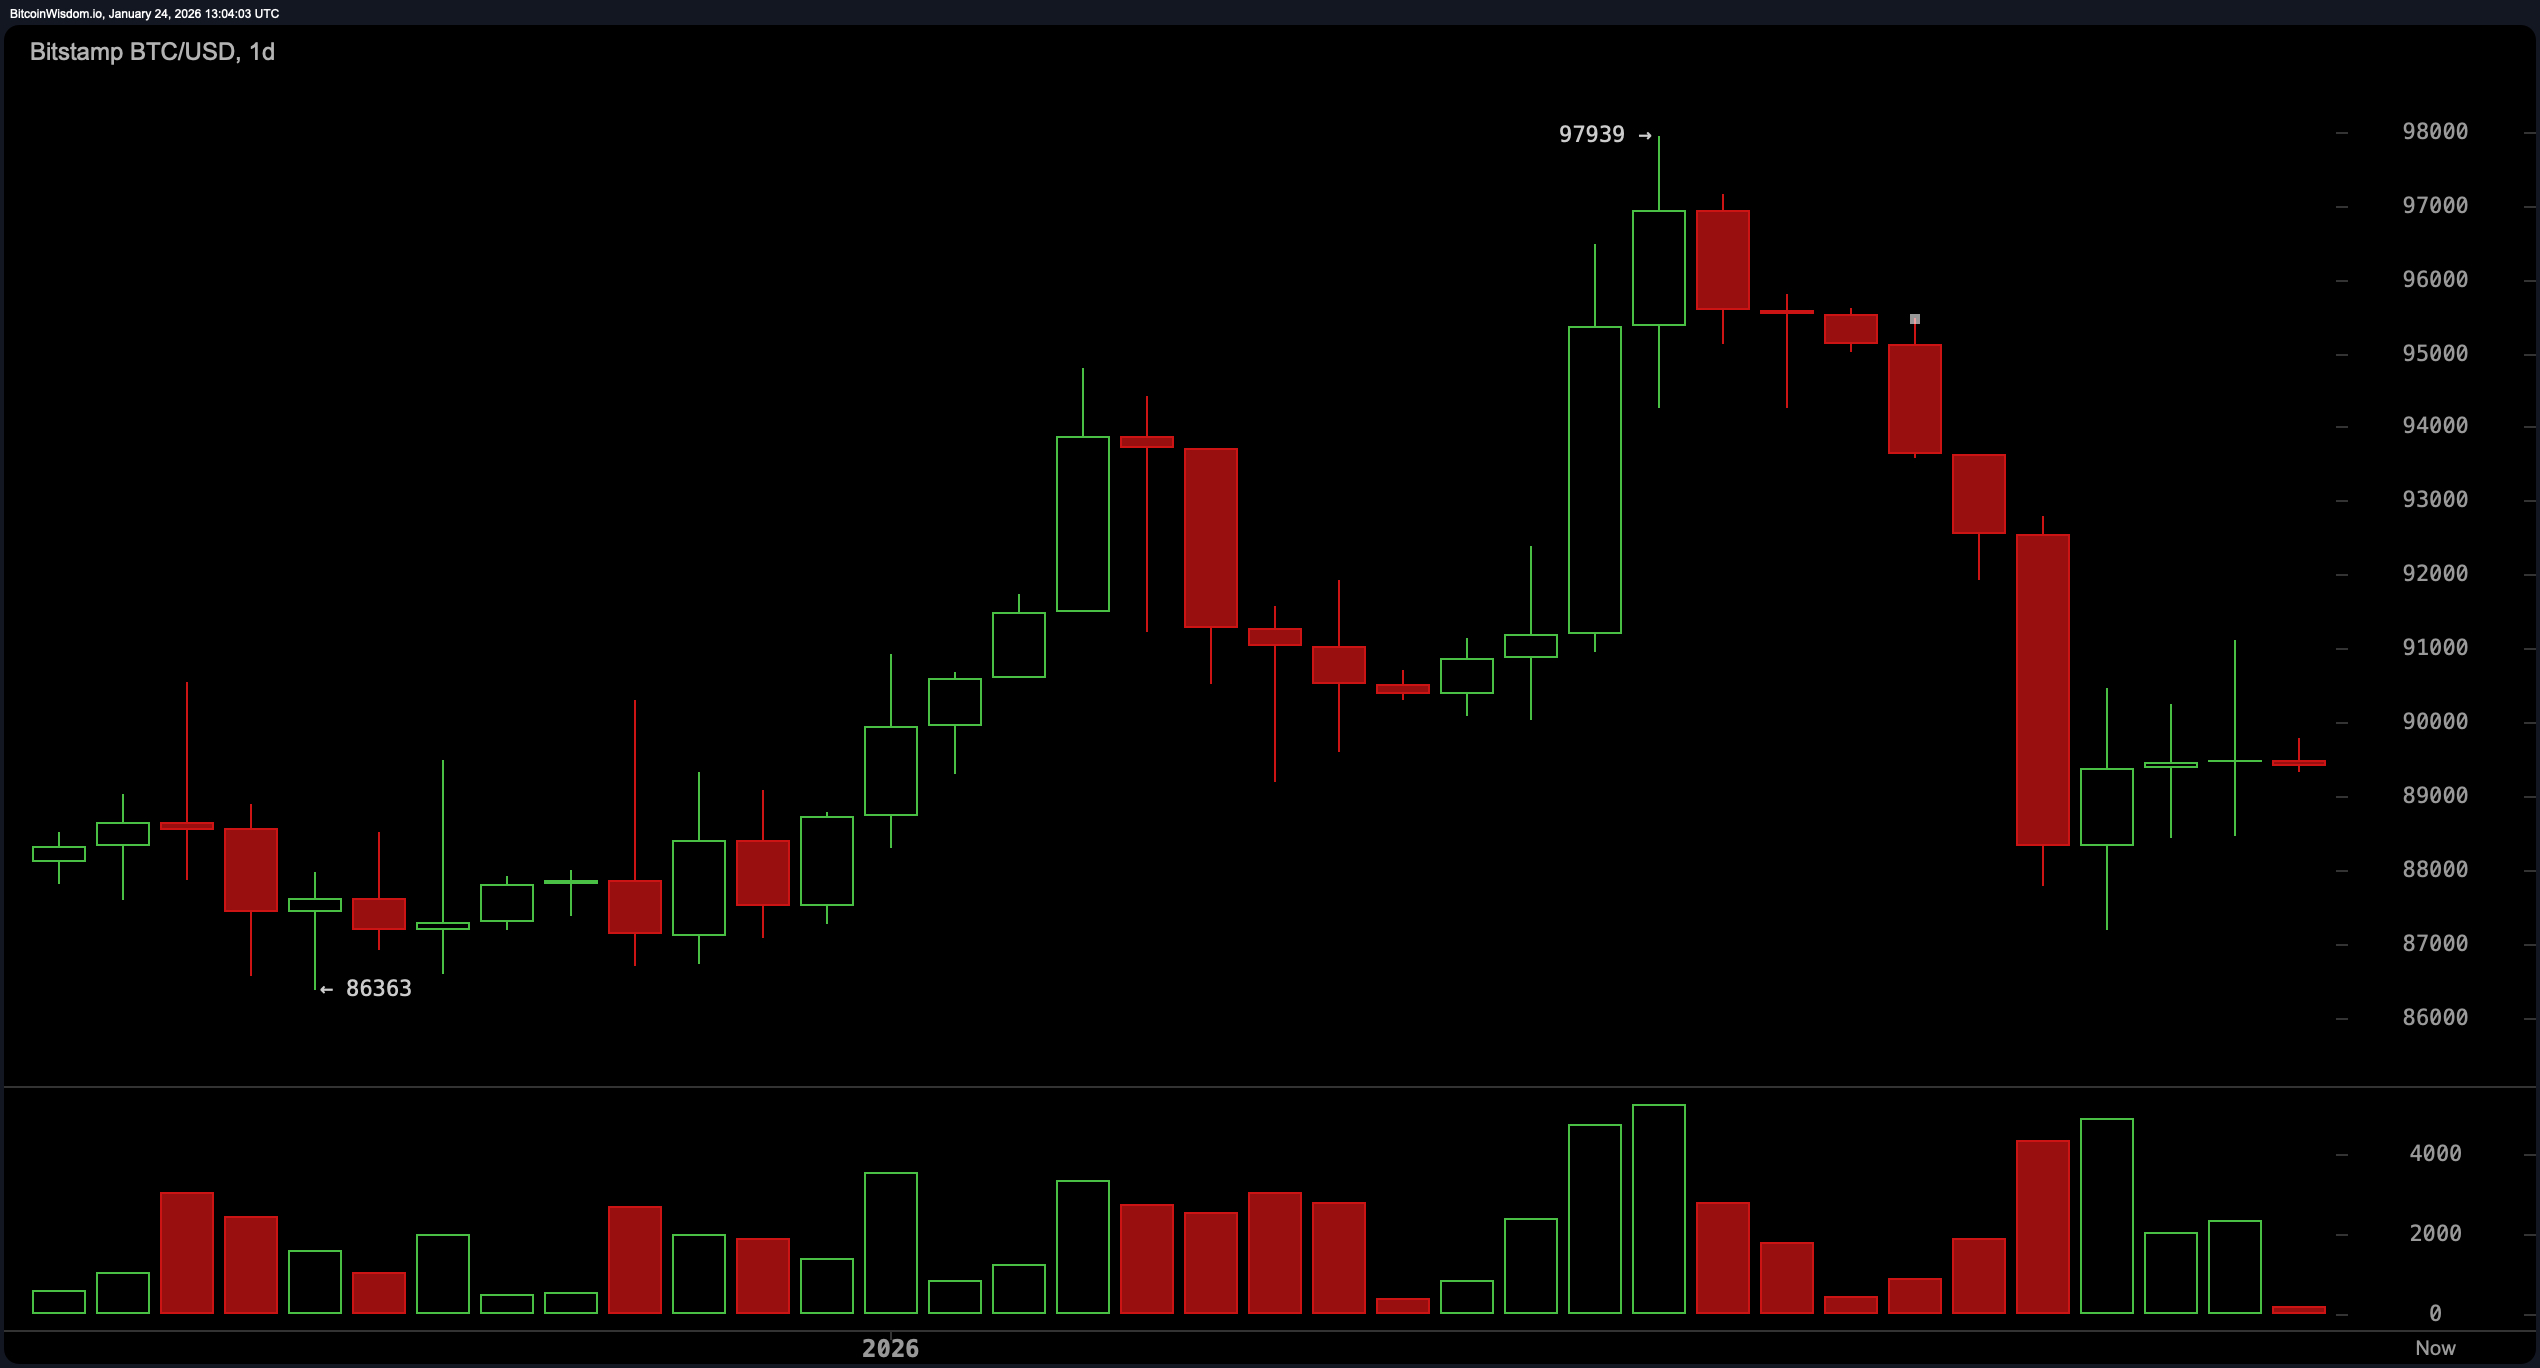
The 4-hour chart reinforces the same cautious optimism. Think of Bitcoin quietly sipping coffee and contemplating its next big move. The drop from $95,480 to $87,193 has stabilized into a sideways move, with volume trading in a tight candlestick. A small spike from January 23rd to 24th suggests interest, but is far from a definitive boost. What is the sweet spot to focus on? A confirmed breakout above $90,500 could open the door to a short-term uptrend. But if you don’t turn up your microphone volume, your breakout attempts may fail.
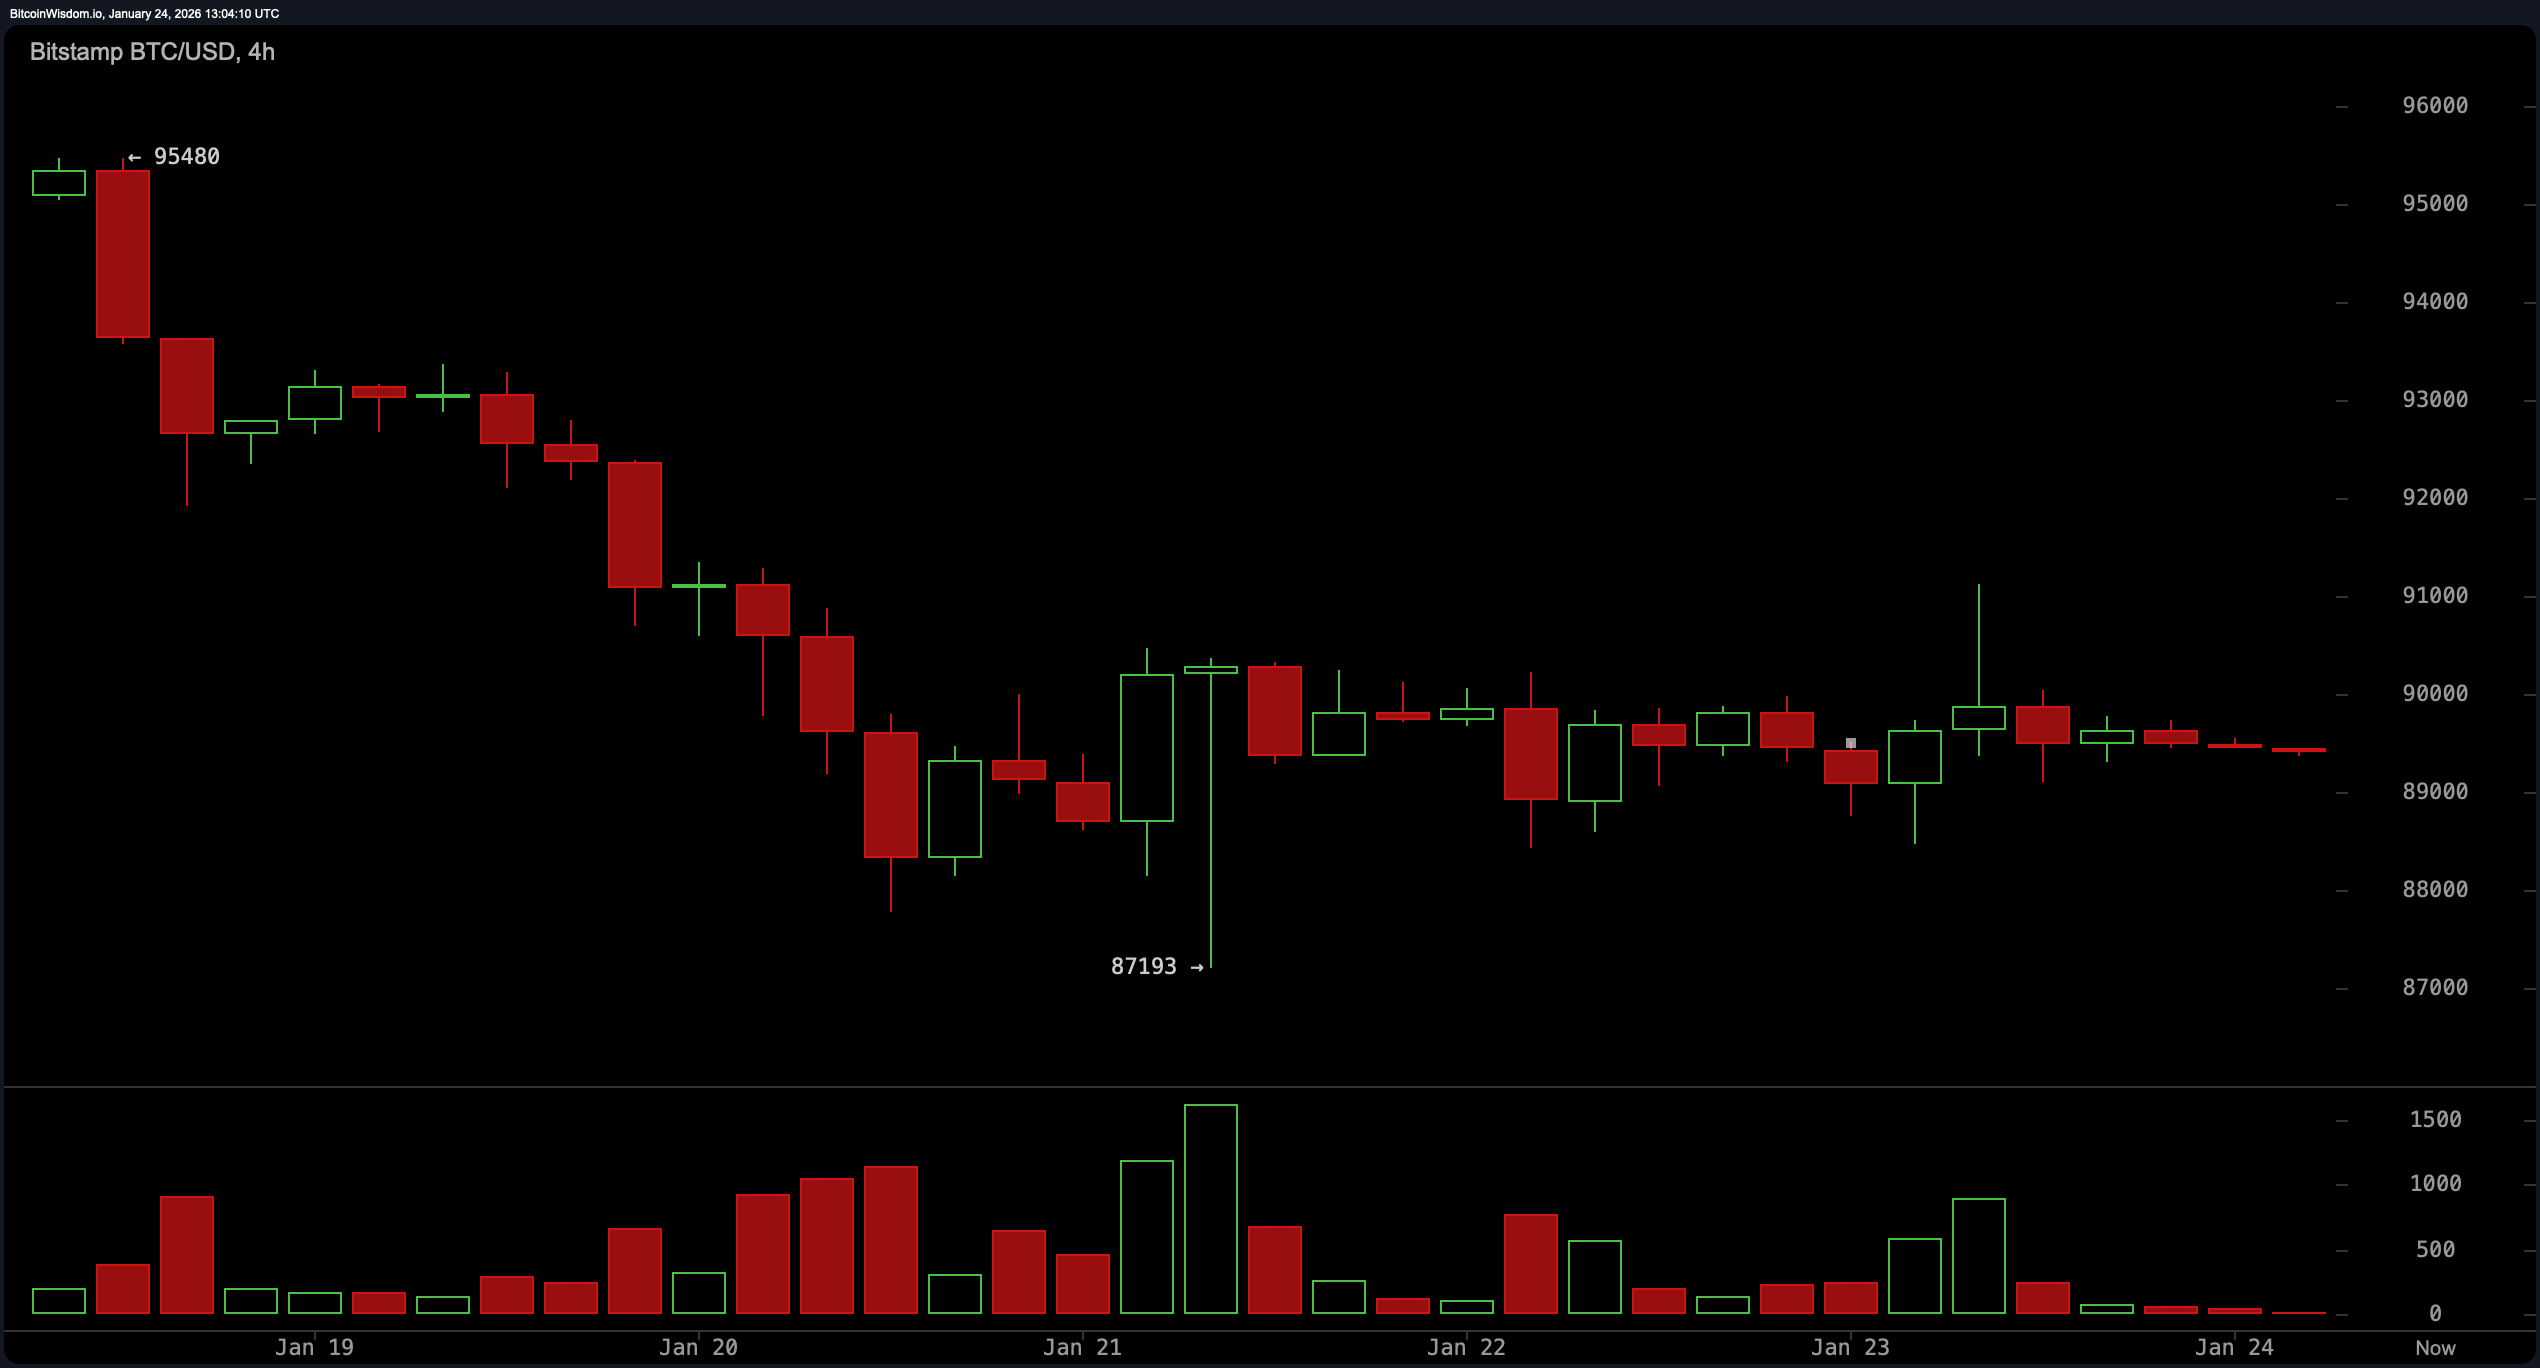
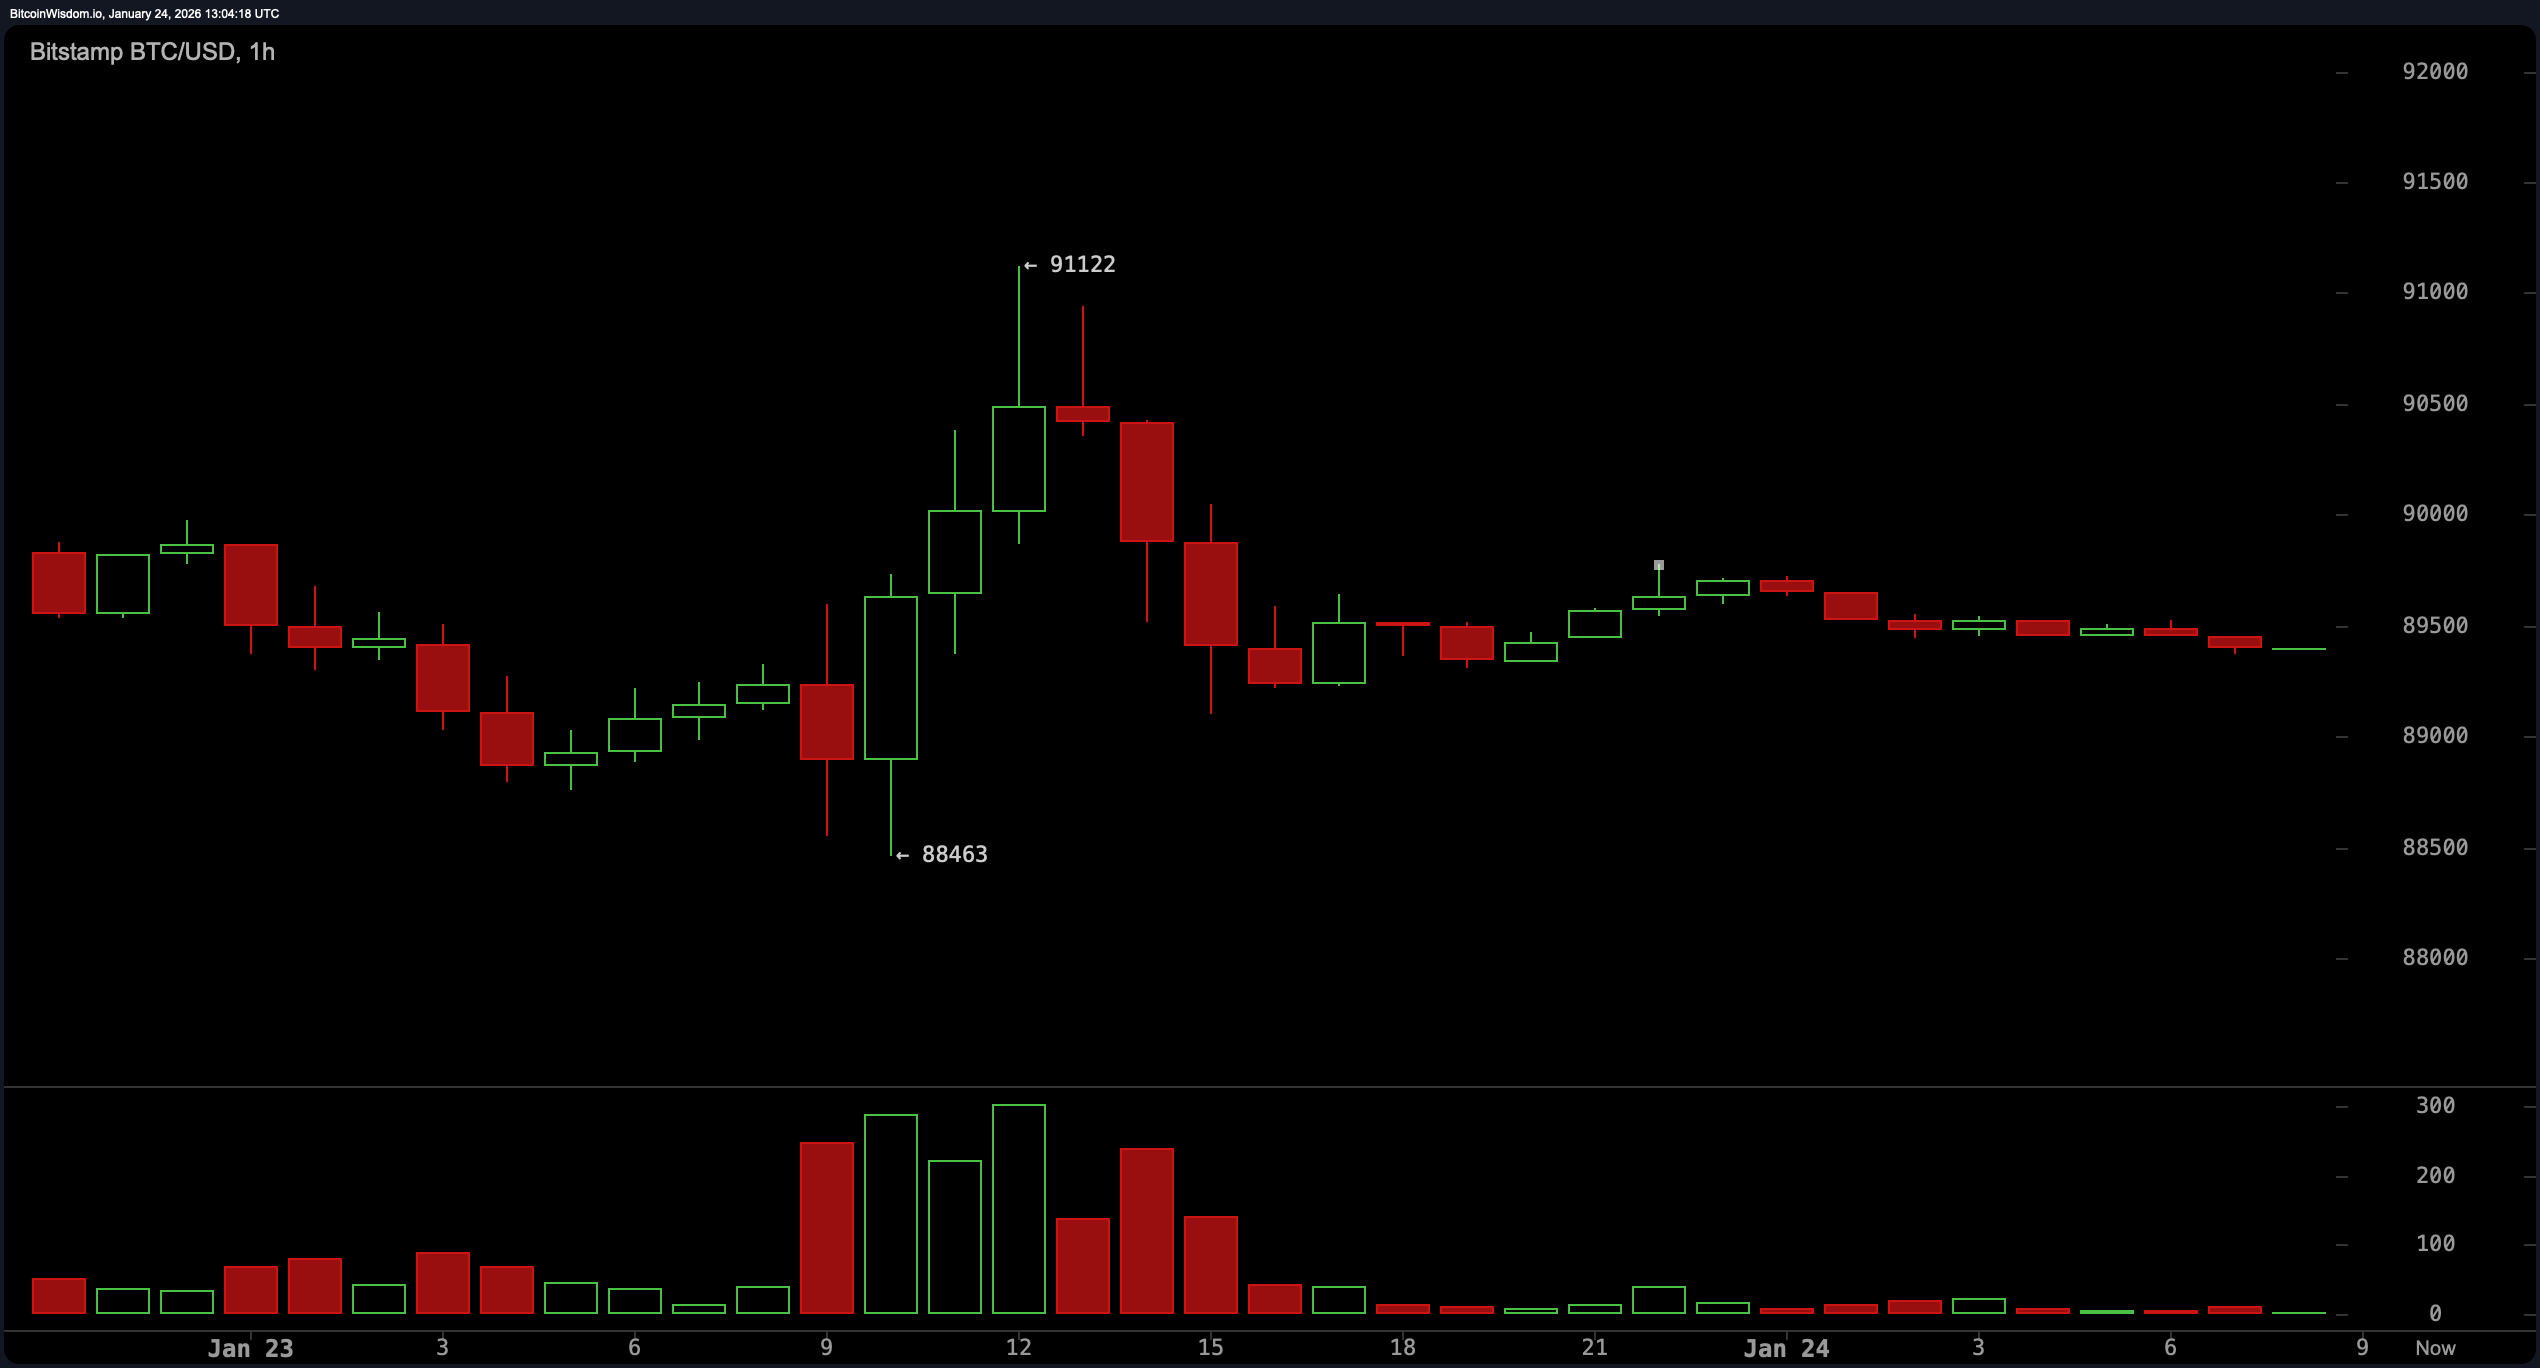
Zooming in on the hourly chart, Bitcoin’s movement has taken on a more volatile nature, with the cryptocurrency hopping between $88,500 and $91,000, like a squirrel. The rising pattern at the lows suggests a slight uptrend is underway, but the latest rejection at $91,122 casts doubt on the momentum. Volume continues to be low, indicating a decline in the market’s risk appetite. A clean break above $91,000 with a volume punch could trigger a rapid move towards the $91,500-$92,000 zone. Until then, short-term traders may closely monitor the decline to $88,500 for a possible entry, assuming support does not ghost them.
The oscillator plays the role of a diplomatic observer. The Relative Strength Index (RSI) is neutral at 43, with no strong clues. The Stochastic Oscillator is also cool at a neutral 21, while the Commodity Channel Index (CCI) is in neutral territory at -84. However, some glumness has surfaced in the momentum indicator, which is registering a value of -7,546, and the Moving Average Convergence Divergence (MACD) level is not necessarily bright at -146, both of which have a bearish slant. In other words, indicators are as cautious as a cat sniffing new furniture.
The moving averages are RSVPing to the bears and all are pointing south. All major exponential moving averages (EMAs) and simple moving averages (SMAs) from the 10-period to the 200-period are currently above the price, each indicating pressure. The 10-period EMA is 90,867 and the 200-period SMA is 105,248, well above Bitcoin’s current position. With this complete logjam of resistance, this asset needs some convincing of action before the bull run takes hold. Until prices move well above these averages, upward momentum remains a speculative whisper.
In summary, Bitcoin is leaning towards the support zone while the indicator is hedging its bets. The chart tells us that the market is stuck at a crossroads. Although momentum is waning, a breakout is still within the realm of possibility. Patience is not a virtue here, but a strategy.
Bullish verdict:
If Bitcoin can muster the strength to break above $91,000 on convincing volume, a short-term recovery towards $94,000-$95,000 is not out of the question. The oscillator may be neutral, but the price structure suggests a possible bounce from support. Momentum remains cautious, but bulls could find footing if resistance levels start to fall.
Bear verdict:
The path of least resistance continues to be to the downside, as all major moving averages are stacked above the current price and momentum indicators are flashing red. Reduced volume and failed breakouts reinforce market hesitancy. Unless Bitcoin convincingly breaks through the overhead resistance, the bears will remain firmly in control of the stage.
Frequently asked questions ❓
- What is the price of Bitcoin today? Bitcoin is trading at $89,396 as of January 24, 2026.
- What is Bitcoin’s current support level?The main support is between $86,000 and $88,000.
- Where is Bitcoin facing resistance?The main resistance zones are $91,000 and $94,000-95,000.
- Is Bitcoin trending up or down now?The chart shows a weak rebound due to bearish pressure from the moving averages.