After briefly rebounding in price from $86,000 to $90,000 earlier in the week, Bitcoin appeared to be experiencing daily movement within consolidation. However, the market is on edge with curiosity about what is going on with the flagship cryptocurrency, especially after its rapid fall to $81,000. Several new on-chain perspectives have emerged that delve into the underlying dynamics of the BTC market.
On-chain is sending signals behind Bitcoin’s bearish move
In a recent post on social media platform X, crypto analytics firm Glassnode outlined a series of on-chain events that justified Bitcoin’s impulsive decline. The analysis began with usage results by LTH/STH metrics.
This indicator shows that long-term Bitcoin holders have significantly distributed their share of BTC over the past 30 days. According to Glassnode data, over 12,000 BTC per day (on average) was distributed over the past 30 days. This equates to 370,000 BTC per month. As expected, the large BTC distribution was reflected in the price as considerable selling pressure.
However, LTH-to-LTH distribution was not the only event that occurred. The US Bitcoin Spot ETF has also recorded multiple net outflows in the past few weeks, adding to the bear market. This means there is less demand from institutional investors to cushion the decline in LTH.

Source: @glassnode on X
As a demand gap emerges as LTH continues to decline, BTC prices are expected to fall freely, especially if bearish momentum enters the market. Therefore, this may have played a role in the recent decline.
It wasn’t just long-term holders who sold. An indicator of net transfers between miners shows that Bitcoin miner behavior is also reinforcing market structure vulnerabilities. Glassnode reported that miners are continuously transferring BTC to exchanges, increasing structural bearish pressure, as positive exchange inflows often indicate increased interest in offloading assets.
Derivatives market trends also played a role in exacerbating the decline in BTC prices. As the flagship cryptocurrency lost its previous footing, a long wave of liquidations followed. Glassnode highlighted that over $300 million was liquidated in this move. Forced liquidations of long positions, as in this cycle, typically amplify downside momentum and push prices further down.
With options market speculation being defensive rather than optimistic, and spot demand also subdued, it is safe to conclude that the Bitcoin market is in a critical phase. Bitcoin may face trouble falling below key resistance levels in the coming days until significant demand flows into the market.
Bitcoin price overview
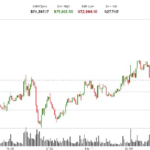
At the time of writing, Bitcoin’s value is $84,095, reflecting a price increase of over 1% in the past 24 hours.
The price of BTC on the daily timeframe | Source: BTCUSDT chart on TradingView
Featured image from iStock, chart from TradingView
editing process for is focused on providing thoroughly researched, accurate, and unbiased content. We adhere to strict sourcing standards, and each page is carefully reviewed by our team of top technology experts and experienced editors. This process ensures the integrity, relevance, and value of your content to your readers.