
The market is showing real fear, with liquidity stress and risk-off sentiment driving the situation, with Bitcoin price hovering just above key daily support today.
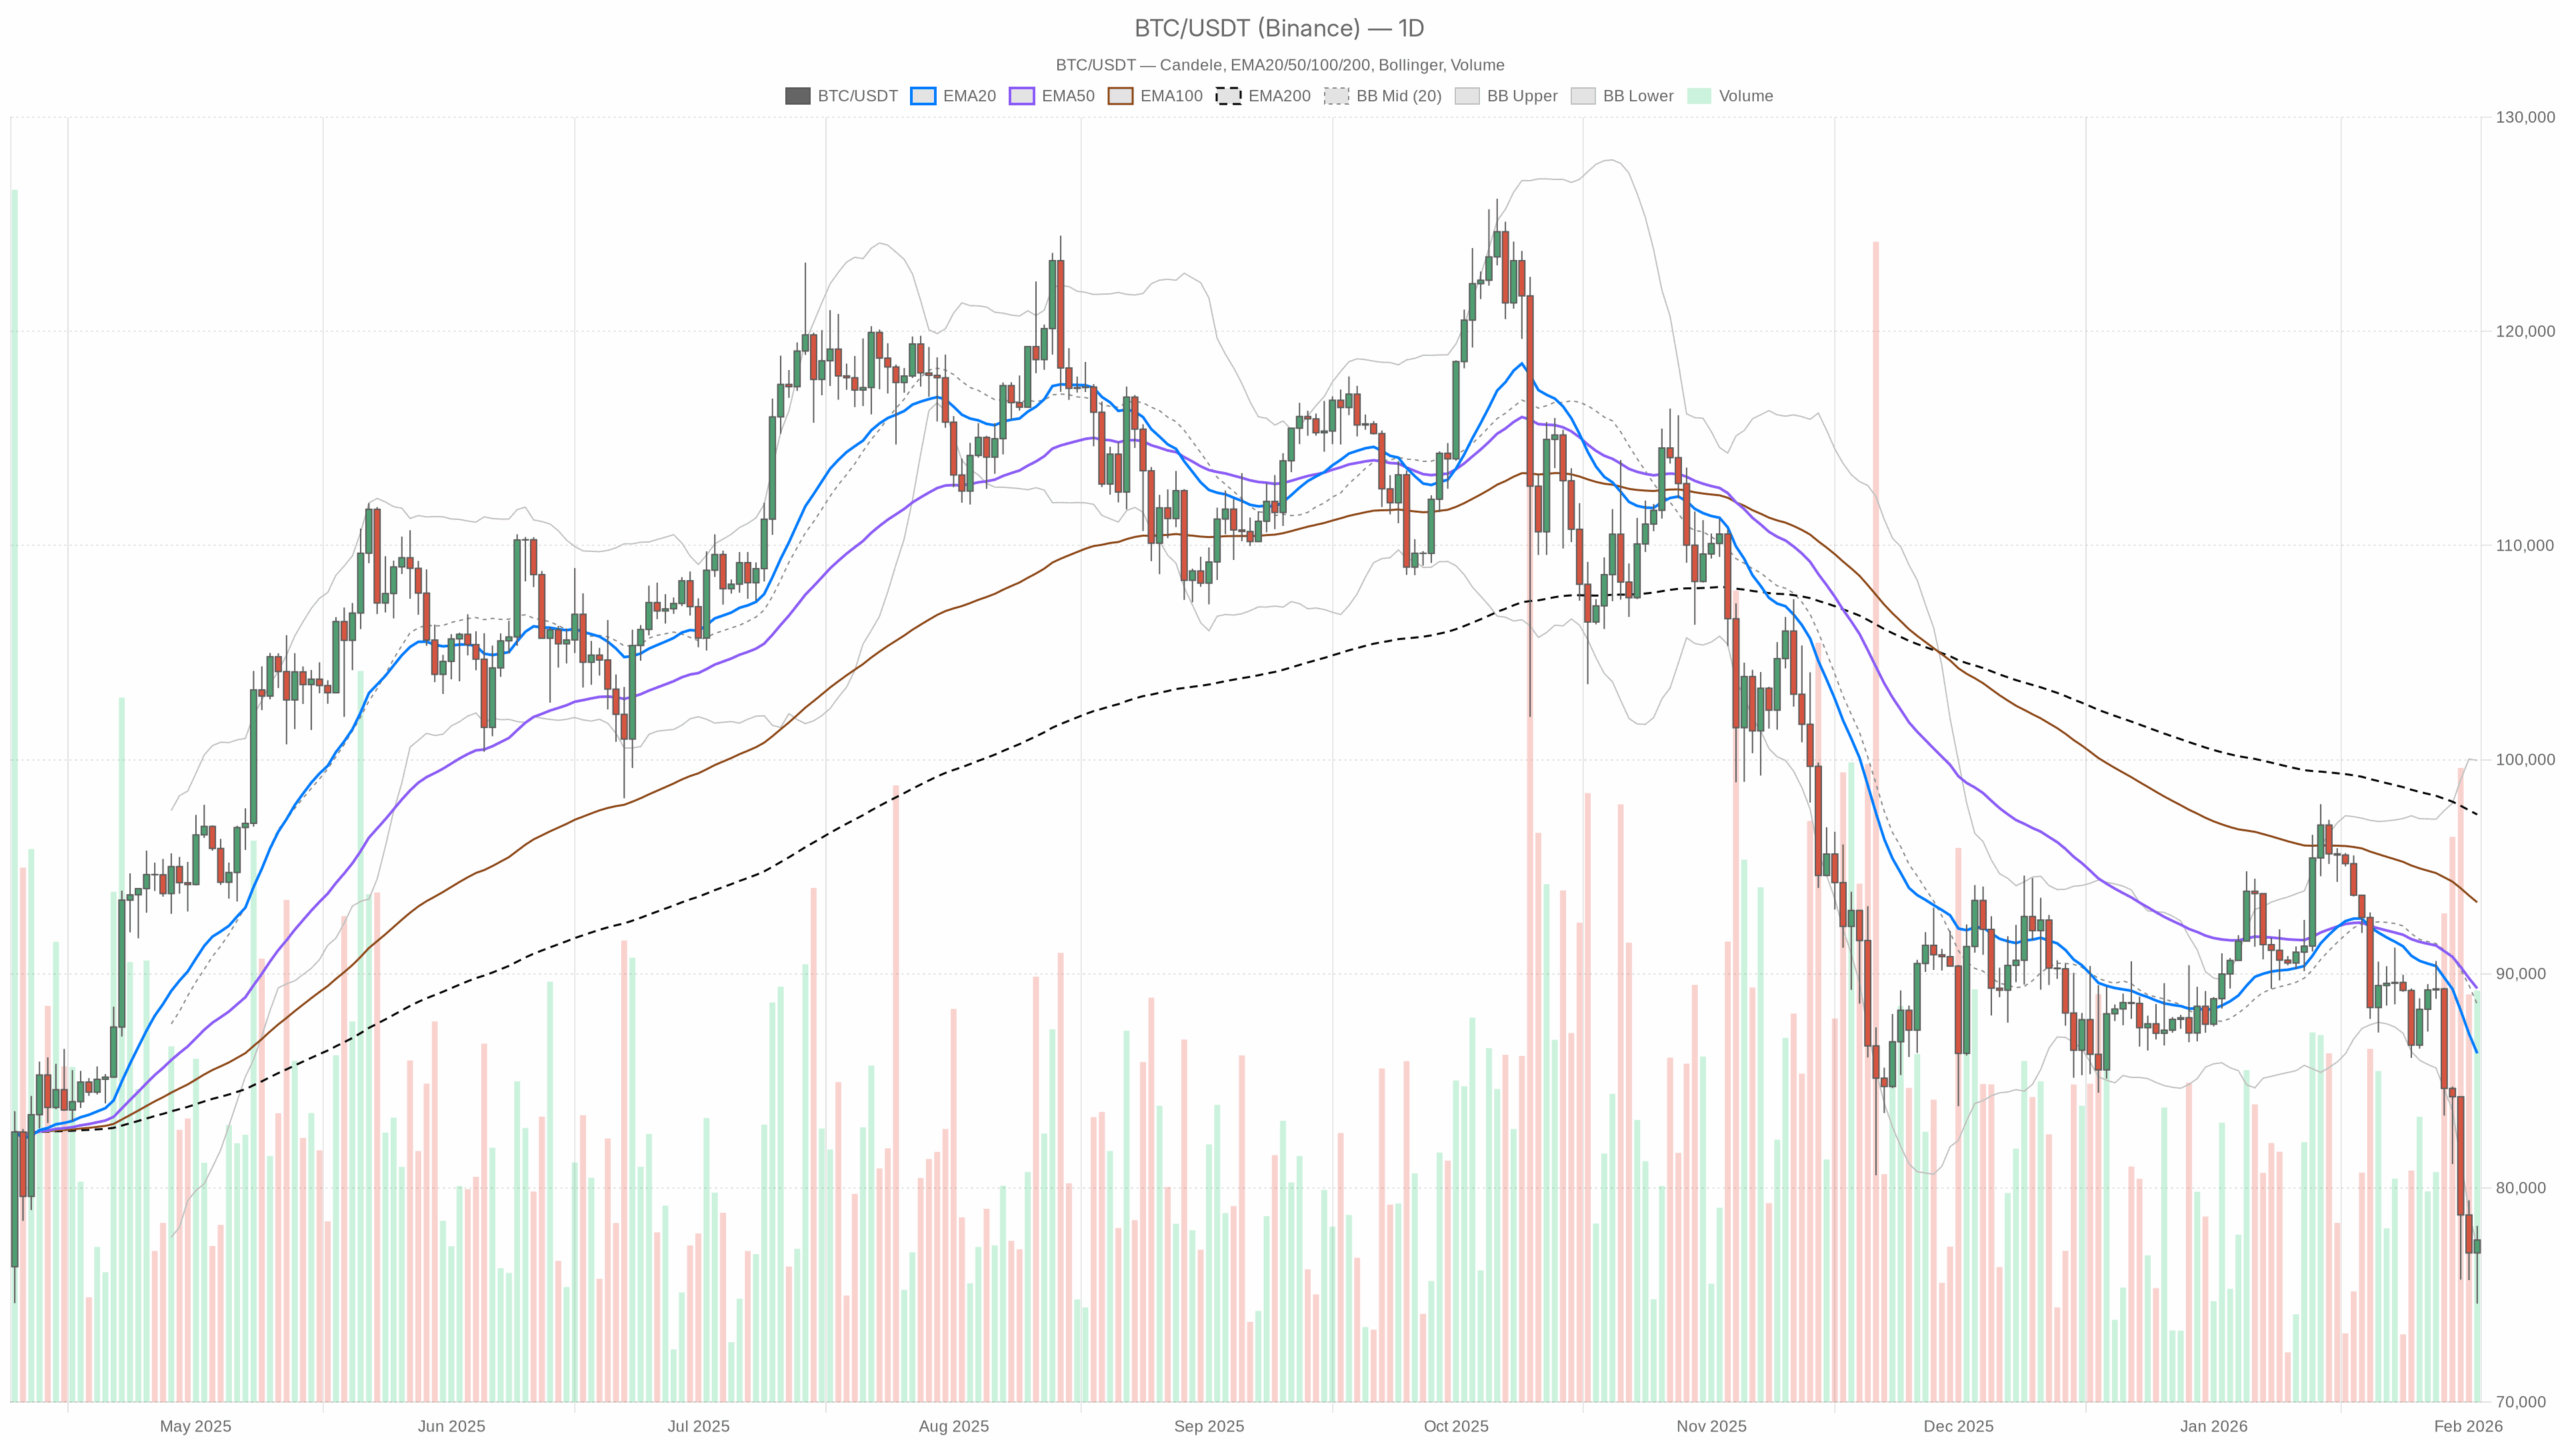 $BTC/$USDT Daily chart including EMA20, EMA50, and volume
Loading=”lazy” />
$BTC/$USDT — Daily chart including candlesticks, EMA20/EMA50, and volume.
Daily chart (D1): The underlying trend is bearish
Trend structure and EMA
– price: $77,570
– EMA 20: $86,292
– EMA 50: $89,319
– EMA 200: $97,441
– Regime flag: bearish
Bitcoin is being traded below all three major EMAs20 < 50 < 200 configurations are fully stacked on the bottom. This is a textbook downtrend profile. So far, the rise in the low to mid $80,000s is converge on supplynot the beginning of a new bullleg. To repair this, $BTC It will need to regain the 20-day EMA and sustain above it. Approximate price at the moment is Under $8,700 This line is a big gap for spot buyers to cross.
RSI (Momentum and Fatigue)
– RSI 14 (D1): 25.35
The daily RSI is deep in oversold territory. This tells us two things at once: (1) strong downtrendand (2) the market is reaching the next zone. Counter-trend rebound is more likely to occur. Historically, when the daily RSI is compressed this much, violent short-covering rallies are common. However, in a bear market, these can resolve in the short term. In other words, the market is growing, but there is no obligation to bottom here.
MACD (trend strength)
– MACD line: -3057
– Signal line: -1563
– Histogram: -1494 (negative)
Daily MACD is Make sure the line below the signal is negative. and a wide negative histogram. it is, Bearish momentum remains subdued. There are no signs of a bullish crossover forming yet. From a trend following perspective, the path of least resistance on the daily time frame is: still down or sidewaysit is not a clean V-shaped inversion.
Bollinger bands (volatility and extreme values)
– BB Mid: $88,579
– BB upper: $99,966
– Lower BB: $77,192
– price: $77,570 (near the lower band)
Bitcoin is being traded Located at the top of the daily Bollinger Bands. Price is effectively approaching the lower end of the volatility envelope. it matches well panic or forced sale It may precede short-term mean reversion. However, if the market is at the lower end of a bear market, it can remain oversold and fall for several days. Therefore, this is not a clear buy signal. that’s a warning Late-Short Stocks Are Currently Pushing Prices Into Stretch Zone.
ATR (volatility and risk)
– ATR 14 (D1): $3,474
Around daily ATR $3.5 million A typical daily swing is approximately 4.5% of current price. Volatility is rising but has not reached capitulation levels. For positioning, this means Placement of stops should be wide Compared to normal situations, you usually need to reduce the size when trading from the daily chart. It is also A sharp reversal during the day The larger bearish structure remains unchanged.
daily pivot level
– Pivot Point (PP): $76,802
– R1: $79,000
– S1: $75,373
Prices are currently changing Slightly more than daily pivot. In fact, it means that the market fight over direction During the day it is just around the main reference level. push up $79,000 (R1) While the door opens for a deeper pullback towards the low $80,000s, a break below will open the door for a deeper rally. $75.4,000 (S1) There is room for another ATR size lower leg and the downside is exposed again.
Hourly chart (H1): short-term stabilization within a downtrend
Trend and EMA
– price: $77,569
– EMA 20: $77,216
– EMA 50: $78,670
– EMA 200: $83,546
– Regime flag: neutral
On the hourly chart, the current price is Although above the 20-hour EMA, it is still below 50 and 200.. it is Pause on a short-term basis or within a larger downtrend. During the day, the seller no longer has absolute control, but the structure still remains. Rebounding amid a broader bear market. Around the 50 hour EMA 78.7 thousand dollars This is the first meaningful intraday resistance. In addition, nearly 200 hours 83.5 thousand dollars This is where real pressure will start to threaten the bearish narrative.
RSI (intraday momentum)
– RSI 14 (H1): 50.55
RSI per hour is basically neutral. After the decline, momentum has slowed and the market is trying to determine whether this will turn around. pause before lowering the other foot Or the beginning of a bigger backlash. Momentum alone in this time frame does not give it a clear advantage.
MACD (intraday trend shift)
– MACD line: -460
– Signal line: -665
– Histogram: +205
The MACD line is still negative but has crossed above the signal. positive histogram. that’s early in the day Bullish divergence and mean reversion It usually looks like this: Although it does not reverse the day-to-day bias, it states: Shorts are starting to take profits And dip buyers are testing that possibility.
Bollinger Bands (H1)
– BB Mid: $77,032
– BB upper: $78,347
– Lower BB: $75,717
– price: $77,569
On the hourly chart, $BTC trading Between the midline and the upper band. Selling pressure from previous sessions has eased and prices are consolidating within the band range. it matches the following Cool down after impulsive movementsthe volatility is compressed before the next leg.
ATR and intraday pivot
– ATR 14 (H1): $1,219
– Pivot Point (PP): $77,640
– R1: $77,805
– S1: $77,404
ATR per hour 1.2 thousand dollars it shows Intraday variation of 1.5% is normal here. Price is trading almost exactly at the time pivot, a classic tug-of-war zone. of 77.8 thousand dollars Area (R1) is the immediate resistance for scalpers. If prices can move past that and build acceptance, then the path to that starts to open up. $79,000-$80,000. lose 77.4 thousand dollars The market is then likely to retest the daily pivot and the low $76,000 level.
15 minute chart (M15): Execution context only
Local trend and EMA
– price: $77,569
– EMA 20: $77,042
– EMA 50: $76,911
– EMA 200: $78,482
– Regime flag: neutral
On the 15 minute chart, the price is Above the 20EMA and 50EMA, but still below the 200EMA. In the very short term, buyers are pushing the tape further after the fire sale, but are still trading Under a heavier long-term moving average. This is exactly Countertrend rebound within a downtrend Looks like. Good for entry and risk setting, but not a time frame for determining the big picture.
RSI and MACD (M15)
– RSI 14 (M15): 61.82
– MACD line: +337
– Signal line: +230
– Histogram: +106
Short-term RSI is bullish side of neutralthe MACD becomes positive on the line above the signal. Local buyers are gaining momentum. this is, Continuous intraday bouncebut the RSI is not overbought yet, so there may still be some room to move higher before a local depletion begins. Again, this is Tactical noise occurs against the background of weak daily life.
Bollinger Bands and ATR (M15)
– BB Mid: $76,895
– BB upper: $78,085
– Lower BB: $75,704
– ATR 14 (M15): $361
The price is leaning toward Upper 15 minute zoneindicating short-term buying pressure. The 15 minute ATR is approx. $360approximate local swing 0.5% in either direction is standard. For short-term traders, this Tradeable bounce zonebut they are still operating under the shadow of daily downtrends.
Market structure and sentiment
This moment is important because the data is finally visible real fear. The fear and greed index of virtual currency is 14 – Extreme fear, $BTC Advantage increases as follows ~57.6%the market capitalization of cryptocurrencies is: ~1.2% decrease in 24 hours. Capital is defensive; $BTC Even Bitcoin is on sale when compared to alts. Structurally, this is daily bear market regime Intraday charts only show the short-term mean reversion part.
The macro news flow for 2024 (headlines about liquidity concerns, crashing metal prices, longest losing streak since 2018) is consistent with what the charts are already showing. Forced sales, deleveraging and prioritizing cash over risk.
Here’s the scenario
Bullish scenario (countertrend rebounds first)
For bulls, the realistic next step is It will not reach new highs immediately,but, short cover rally Get out of an oversold situation.
A constructive bullish path looks like this:
1. Daily S1 maintained above approximately $75.4 thousand If it falls further. Ideally, prices continue to respect daily pivots 76.8 thousand dollars on a closing basis.
2. Time structure moves from neutral to bullish: price Recovered and maintained above the 50-hour EMA (approximately $78,700) and push it inside $80,000-$82,000 pocket.
3. The daily MACD starts to contract with a negative histogram and follows an upward curve, while the RSI returns to the top. 30~35suggesting a loss of downward momentum.
If that develops, the market will $83,500-$86,000 zone First half 200EMA and D1 20 Mother Starts to be active. I guess it’s not yet Just an uptrend within a broader downtrend unless there is $BTC can Close above the daily 20-EMA (about $86,000) for a few days, then attack the $89,000-$90,000 zone (around the 50-day EMA).
What invalidates the case for a bullish bounce?
a Clean Daily closing price less than $75,000 Poor next-day follow-through will make a strong case for: Market clearing is not over. In that case, the oversold rebound narrative will fail and the price will likely head into another downleg and will need to find new support lower.
Bearish scenario (trend continuation)
The current prevailing scenario will be maintained Continuation of trend towards lower prices.
The key elements to achieving that result are:
1. Intraday rebound stalls below $79,000-$80,000keeping the price below the hourly resistance and the 50-hour EMA.
2. H1’s RSI retreats from neutral or positive territory without sustained strength, while M15’s momentum reverses from its current bullish stance.
3. Daily price Closed below Bollinger Band Lower ($77,200) and S1 ($75,400)a touch that is currently oversold, Band breakdown.
If that happens, the market will shift to classic Grind rower or flush rower Territory: The $3.5k ATR has plenty of room to expand rapidly to the downside. Extreme Terror is already at 14 and another leg could start forcing the weaker hand to surrender. In such a tape, Rebound to low to mid $80,000 and remain in sell zone Until the daily trend structure changes.
What weakens or invalidates the case for bearish continuation?
Bears will start to lose their advantage if: $BTC:
– Collect and hold over $80,000 At the end of each day, and
– Then top it out over a few sessions. 20 EMA (approximately $86,000) daily The daily RSI is above the mid-40s and the MACD is flat.
This combination indicates that the downtrend is losing its momentum and the market is moving into a broader range or new accumulation phase.
Click here for the positioning, risks, and mindset of Bitcoin
Important points: Bitcoin prices are in a bearish situation today due to oversold conditions and a volatile intraday rebound in the early hours. Trend traders typically respect the downside bias until the daily EMA and momentum clearly reverse. Mean reversion traders see this as a potential opportunity zone, but must accept that they are trading against general trend.
Since the volatility is high enough, Position sizing and stopping distance become more important than usual. A typical daily noise range of $3,000 to $4,000 can easily defeat tight risk controls in the wrong time frame. With feelings of extreme fear, Headline risk rises: More bad macro or liquidity news could accelerate both downward (capitulation) and upward (short squeeze) movements, depending on positioning.
Is the trader bullish or bearish here? What time frame are you trading on?. The daily chart still favors patience and caution. On the other hand, hourly and 15-minute charts only justify short-term tactical plays until they coincide with broader structural changes in the market.
This section contains sponsored affiliate links. We may earn commissions at no additional cost to you.
Market analysis is inherently uncertain. The scenarios described here are conditional, not guarantees, and are based solely on data available at the time of writing.
In summary, the market structure across the time frame shows a dominant daily downtrend, with oversold but not yet a definitive bottom, and only tactical countertrend opportunities for disciplined short-term traders.