
Ethereum price extended its decline to $2,420, below $2,300. $ETH is currently trying to recover from $2,150, but faces a number of hurdles near $2,365.
- Ethereum failed to break above $2,350 and a new decline began.
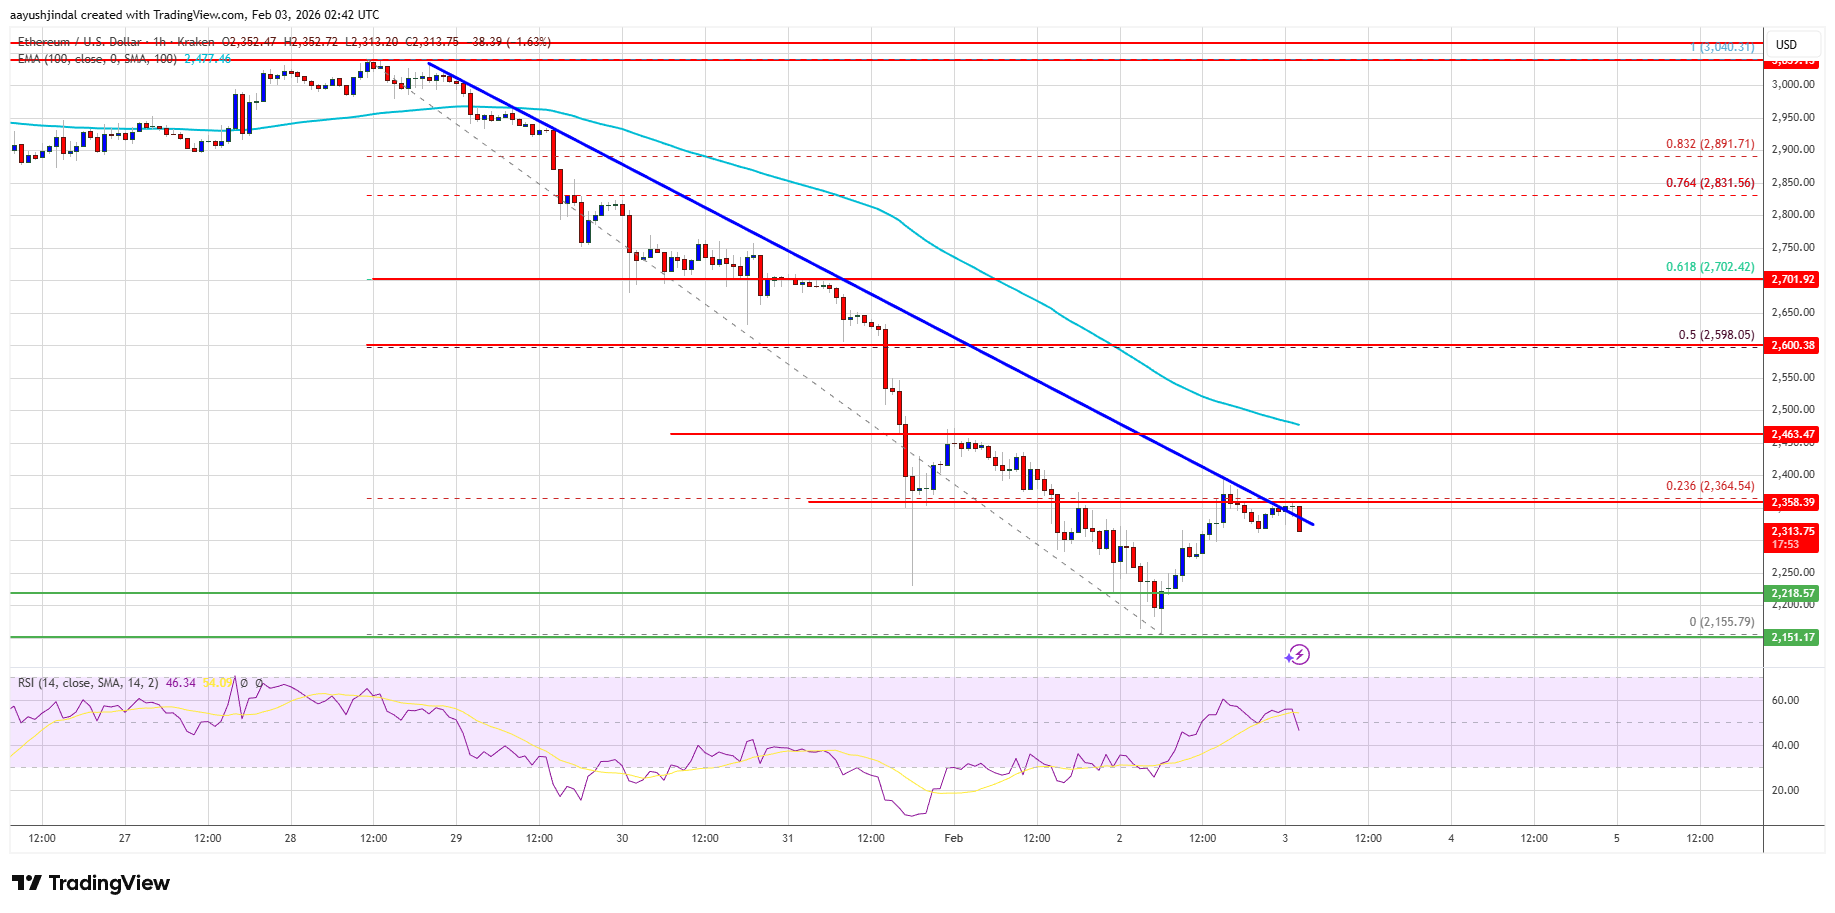
- The price is trading below the 100-hour simple moving average at $2,350.
- On the hourly chart of , there is a major bearish trend line forming resistance at $2,350. $ETH/USD (data feed via Kraken).
- If the price remains below the $2,400 zone, the decline could begin again.
Ethereum price aims for further decline
Ethereum’s price failed to maintain stability above $2,500, and losses widened, similar to Bitcoin. $ETH The price fell below $2,420 and entered the bearish zone.
The bears pushed the price below $2,200. A low was formed at $2,155 and the price is currently trying to recover. There was a move above $2,250. This price tested the 23.6% Fib retracement level on the recent decline from a swing high of $3,040 to a low of $2,155.
However, the bears are active near $2,365. There is also a major bearish trendline forming resistance at $2,350 on the hourly chart. $ETH/USD. Ethereum price is currently trading below $2,350 and its 100-hour simple moving average.
If the bulls sustain the action above $2,250, the price could try to move higher. Immediate resistance is seen near the $2,350 level. The first major resistance level is near the $2,365 level. The next major resistance level is near the $2,450 level. A clear break above the $2,450 resistance could push the price towards the $2,600 resistance or the 50% Fib retracement level of the recent decline from the $3,040 high to the $2,155 low.
A break above the $2,600 area could lead to further gains in the coming days. In the above case, Ether could rise towards the $2,700 resistance zone and even $2,720 in the short term.
further decline $ETH?
If Ethereum fails to break through the $2,365 resistance level, a fresh decline could begin. The first support on the downside is near the $2,250 level. The first major support is located near the $2,220 zone.
A clear move below the $2,220 support could push the price towards the $2,150 support. Any further losses could send the price towards the $2,120 area. The main support could be $2,000.
technical indicators
Hourly MACD – MACD of $ETH/USD is gaining momentum in the bearish zone.
hourly RSI – RSI $ETH/USD is currently below the 50 zone.
Major Support Level – $2,220
Major Resistance Level – $2,365