

Bitcoin’s price is nearly 45% off its all-time high of $126,080, reflecting the deteriorating market conditions over the past few months. One indicator confirming the emergence of a bear market was the decline below the 365-day moving average late last year. Using this indicator, a prominent cryptocurrency researcher published an assessment showing how the current Bitcoin bear market compares to past bear markets.
BTC price is 30% below the 365-day moving average
In a new post on social media platform The indicator we focus on in this analysis is the 365-day simple moving average (SMA) of the BTC price chart.
Moreno defined the beginning of a bear market as the moment Bitcoin price falls below the 365-day SMA. According to on-chain experts, the premier cryptocurrency is down 30% so far at this stage, making it one of the worst bear seasons in recent times.

Source: @jjcmoreno on X
As seen in the chart above, Bitcoin price is even deeper than is often seen at this stage of a bear market. During the 2014 bear market, the leading cryptocurrency was barely down 20% at this stage of the season.
The same was true during the 2018 bear season, when the market was around 20%. However, Bitcoin’s price may have succumbed to further pressure during the 2022 season, as market leader Bitcoin was down nearly 60% from its 365-day moving average at this stage of the cycle.
This trend is particularly interesting given that Bitcoin is considered to be maturing as an asset class. However, the world’s largest cryptocurrency still seems to be witnessing incredible levels of volatility at the start of the bear market.
It is unclear when the Bitcoin price will reach the bottom, but certain conditions must be met for it to reverse. One of these conditions is apparent demand indicators, which have continued to worsen over the past few weeks. Capital constraints are a major issue for this premier cryptocurrency, as seen in the number of outflows of US-based Bitcoin ETFs.
Bitcoin price overview
As of this writing, the price of BTC is around $70,500, reflecting an increase of over 2% in the past 24 hours.
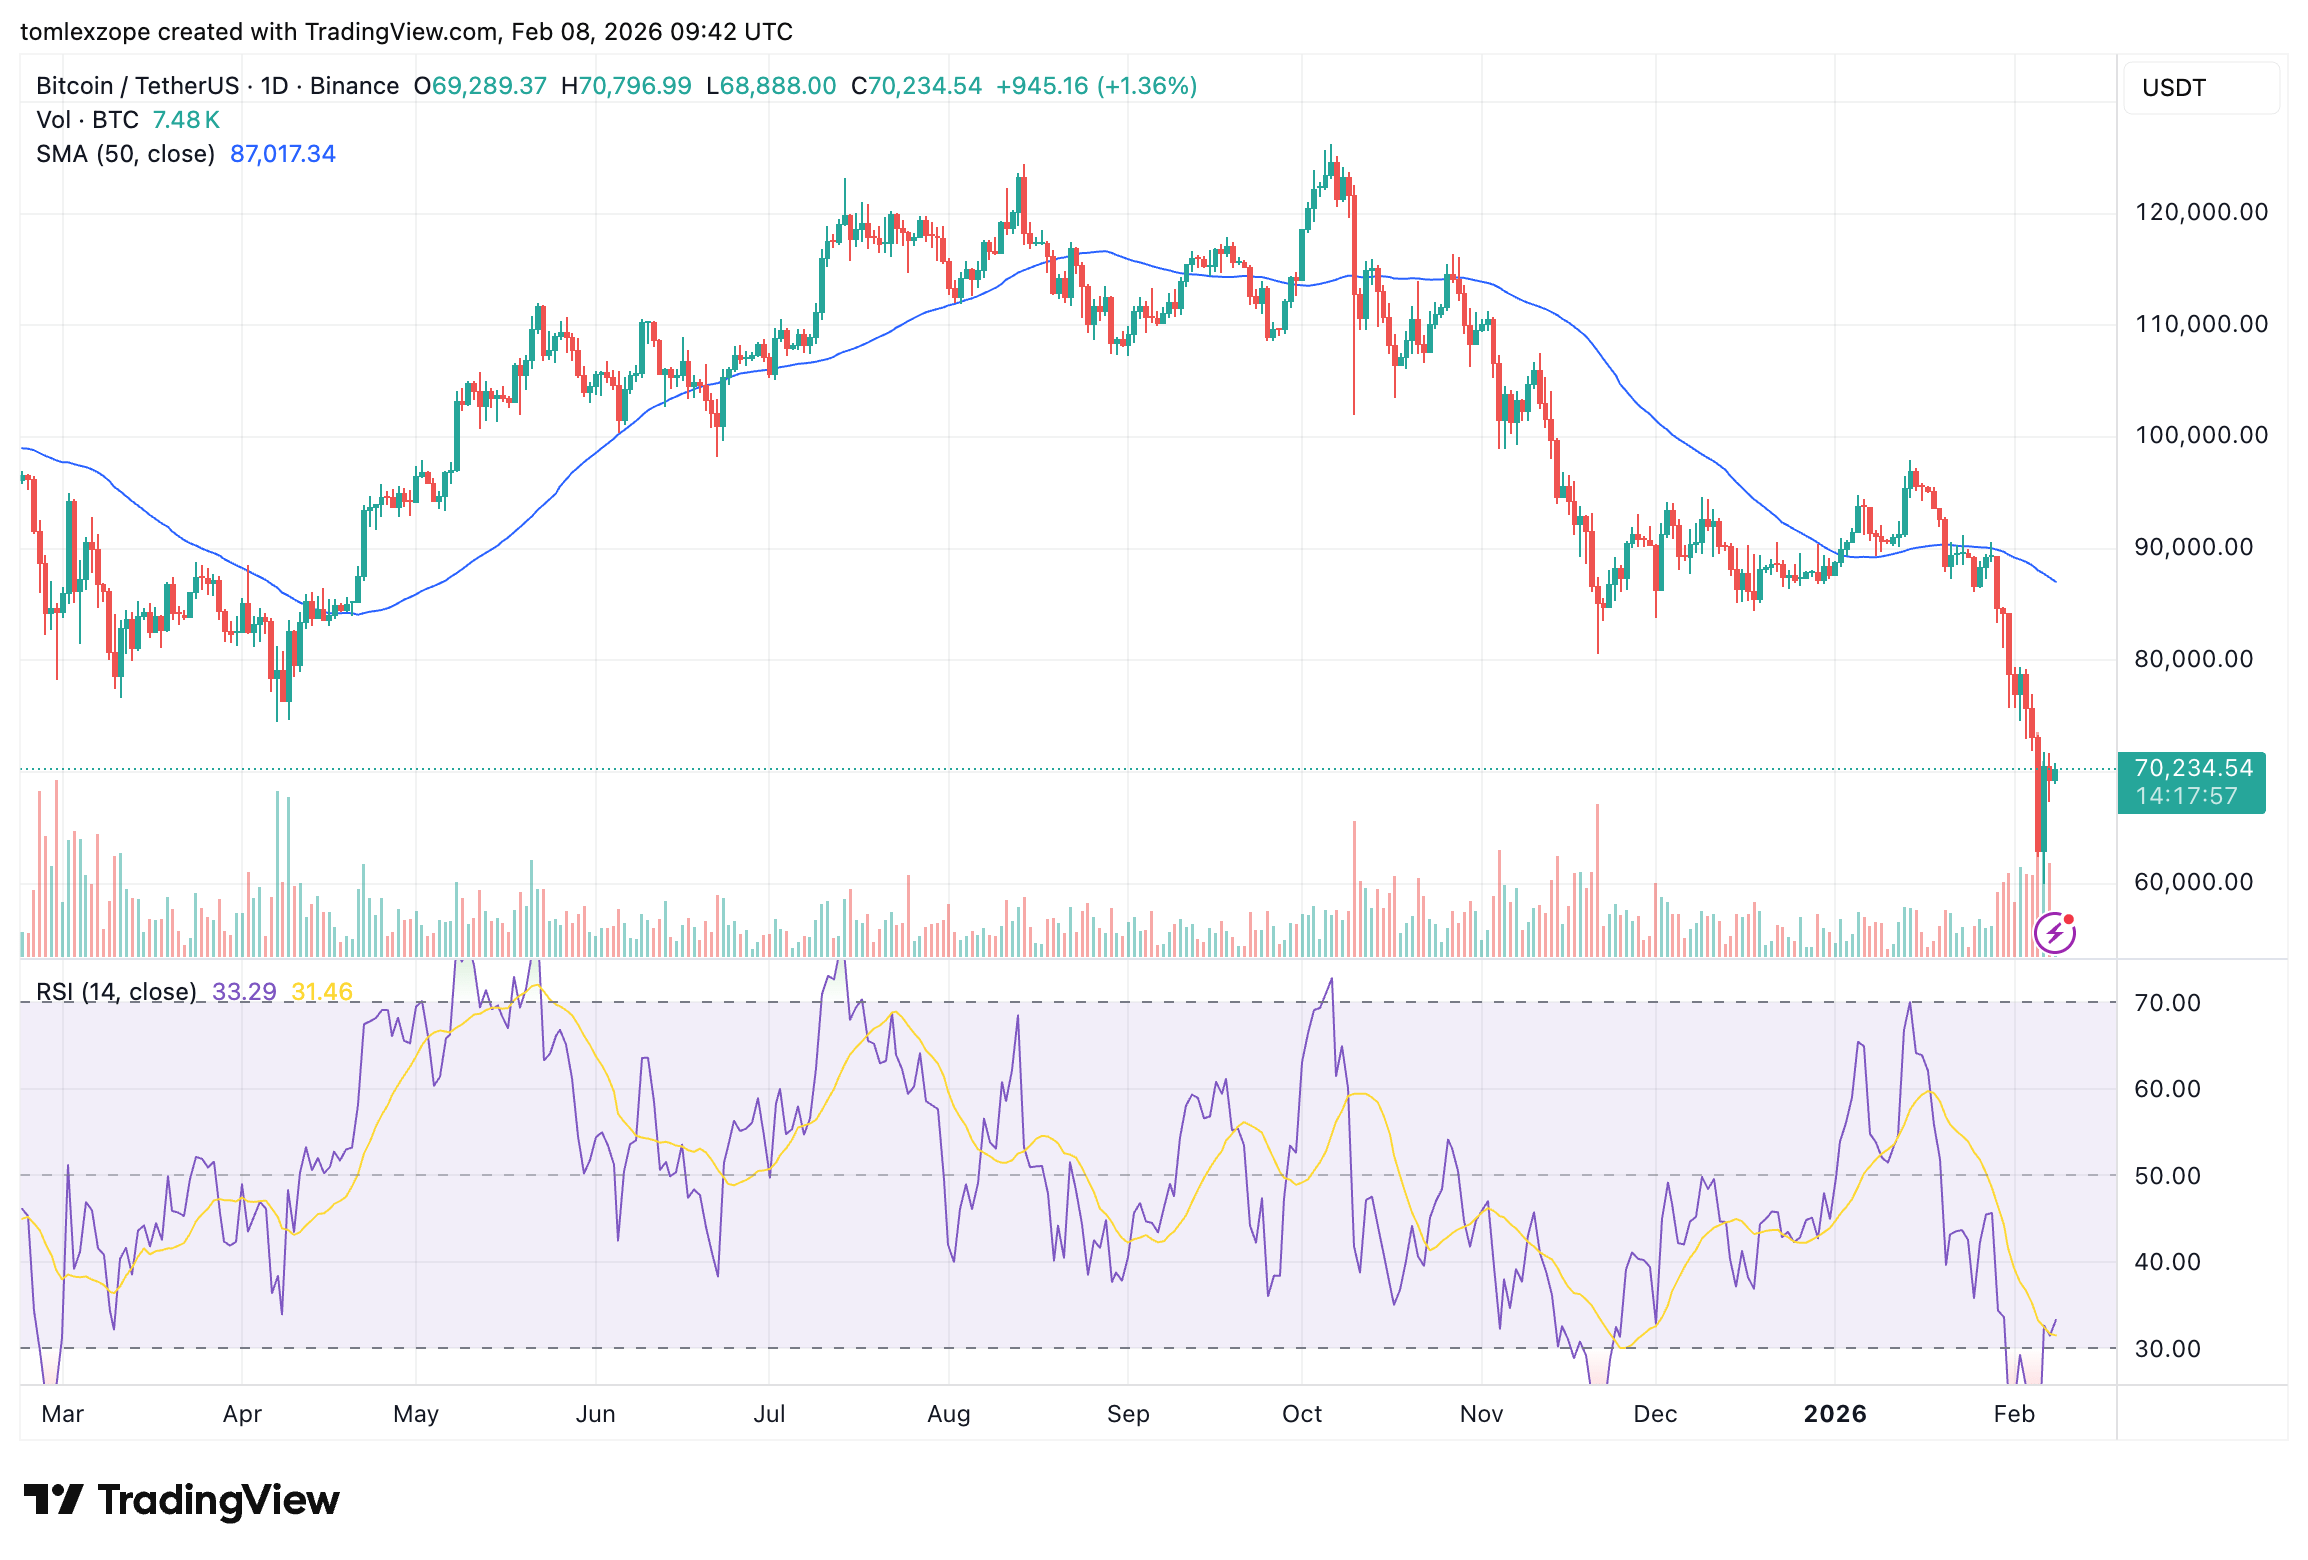
The price of BTC on the daily timeframe | Source: BTCUSDT chart on TradingView
Featured image from iStock, chart from TradingView
editing process for is focused on providing thoroughly researched, accurate, and unbiased content. We adhere to strict sourcing standards, and each page is carefully reviewed by our team of top technology experts and experienced editors. This process ensures the integrity, relevance, and value of your content to your readers.