
- Ethereum price is facing renewed selling pressure at the $2,150 resistance level, signaling the risk of an extended downtrend.
- US Spot Ethereum ETFs are under pressure $ETH Trading at a level well below investors’ average entry price
- The 20-day exponential moving average serves as the first line of defense for sellers to maintain their advantage. $ETH price movement.
Ethereum’s recent rebound from last week’s plunge has already hit the $2,150 wall. The coin price is down 3.9% today, indicating renewed selling pressure and the risk of a continued correction from here. With market sentiment broadly bearish and spot ETFs trading well below their average cost basis, Ethereum price is likely to fall to $1,600 before finding suitable support.
Bearish sentiment prevails $ETH ETFs are sinking deep below the surface.
According to social data provided by Santiment, bears continued to dominate throughout the cryptocurrency debate in early February 2026, with bearish posts significantly outnumbering bullish posts. Retail investors are showing great fear and hesitation in purchasing at prices as low as nearly $2,000. $ETH BTC is between $68,000 and $70,000 as volatility continues. In contrast, key stakeholders and institutions appear to be acquiring supplies with little resistance.
Historically, periods of high FUD and pessimism are often a sign of capitulation, which increases the likelihood of strong price rebounds in subsequent market cycles.
However, the U.S. Spot Ethereum ETF is under significant pressure, with the cryptocurrency trading at a price below $2,000 and well below the estimated average cost basis of $3,500 for inflows into the vehicle. According to Bloomberg ETF analyst James Seifert, this disparity $ETH ETF investors are in a more difficult position than Bitcoin ETF investors. This is because holders participated in these coins at prices close to or below the current price.
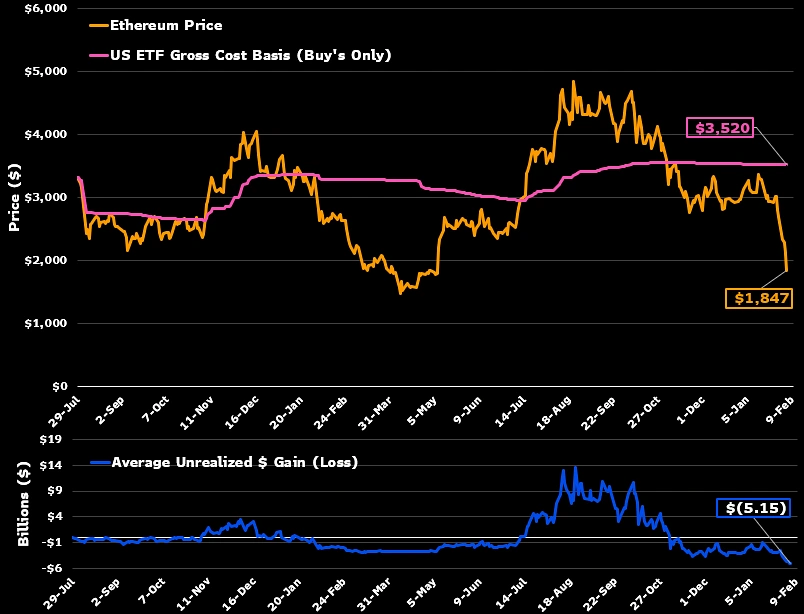
Graphs from Seifert’s analysis show large losses piling up through most of 2025, with drawdowns exceeding 57% continuing into early 2026. Net inflows peaked at $15 billion in late 2025, but have since declined to about $11.7 billion to $12 billion, and net outflows during the recession were only $3 billion. Assets still total about $12 billion, and recent transactions reflect small daily fluctuations rather than large liquidations.
Seifert noted that most participants were holding firm despite large unrealized losses (billions of dollars on average). This is similar to past Ethereum cycles, for example, in April 2025, there was a drawdown of over 60%. While volatility persists and the situation remains difficult to gain confidence in, the resilience is remarkable given its severity.
Ethereum price expected to fall 17% before hitting key support
Since last month, Ethereum price has shown a significant correction from $3,400 to a low of $1,700, registering 48.8%. Over the weekend, the coin price rebounded following a broader market relief rally, but failed to provide immediate resistance at $2,150.
Today’s price drop indicates new lows forming highs. $ETHThe daily chart shows that the selling from investors is rebounding in the same way. The momentum indicator ADX at 51% highlights the strong bearish momentum in the price and suggests the risk of a long-term decline.
If the selling continues, Ethereum price could drop another 17% and rest at the long-term support trendline at $1,630.
Since March 2020, $ETH Buyers have managed to regain bullish momentum on this uptrend line, indicating that there is adequate support to reverse the current downtrend.
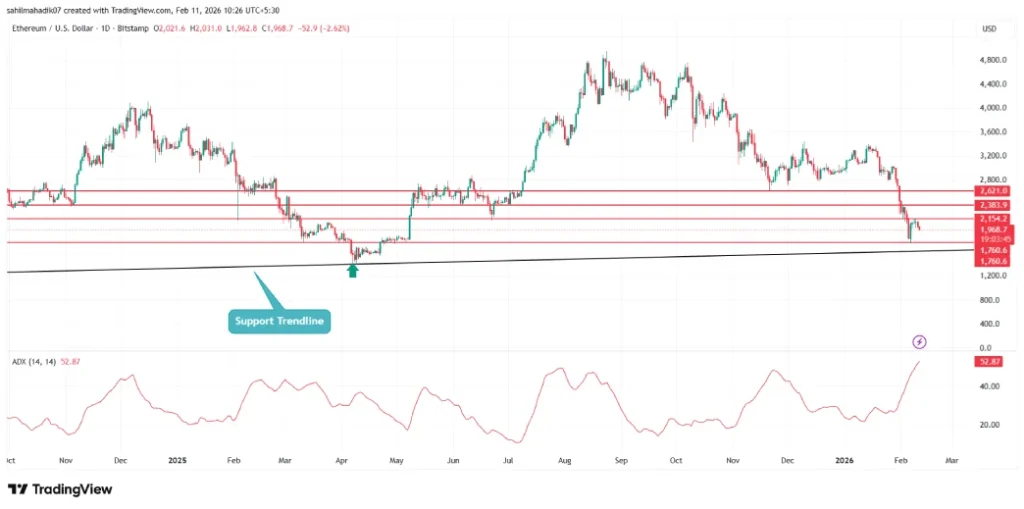
$ETH/USDT – 1D chart
As a result, the coin price is poised to enter a short-term consolidation trend around $1,600 to confirm the sustainability of the bullish rebound.
Also read: Pepecoin price near breakout as whales increase during economic downturn