
Ethereum trades near $2,000 After a sharp decline, the long-term chart movement indicates a final leg up in a multi-year structure. Short-term price action is currently tense in the triangle, preparing for the next decisive move as momentum cools.
Ethereum counts “diagonal expansion” as $9,000-1,8,000, zone marks next target
Ethereum continues to track what analyst Gerd van Lagen described as a “textbook extended diagonal” on its biweekly chart. In a post to
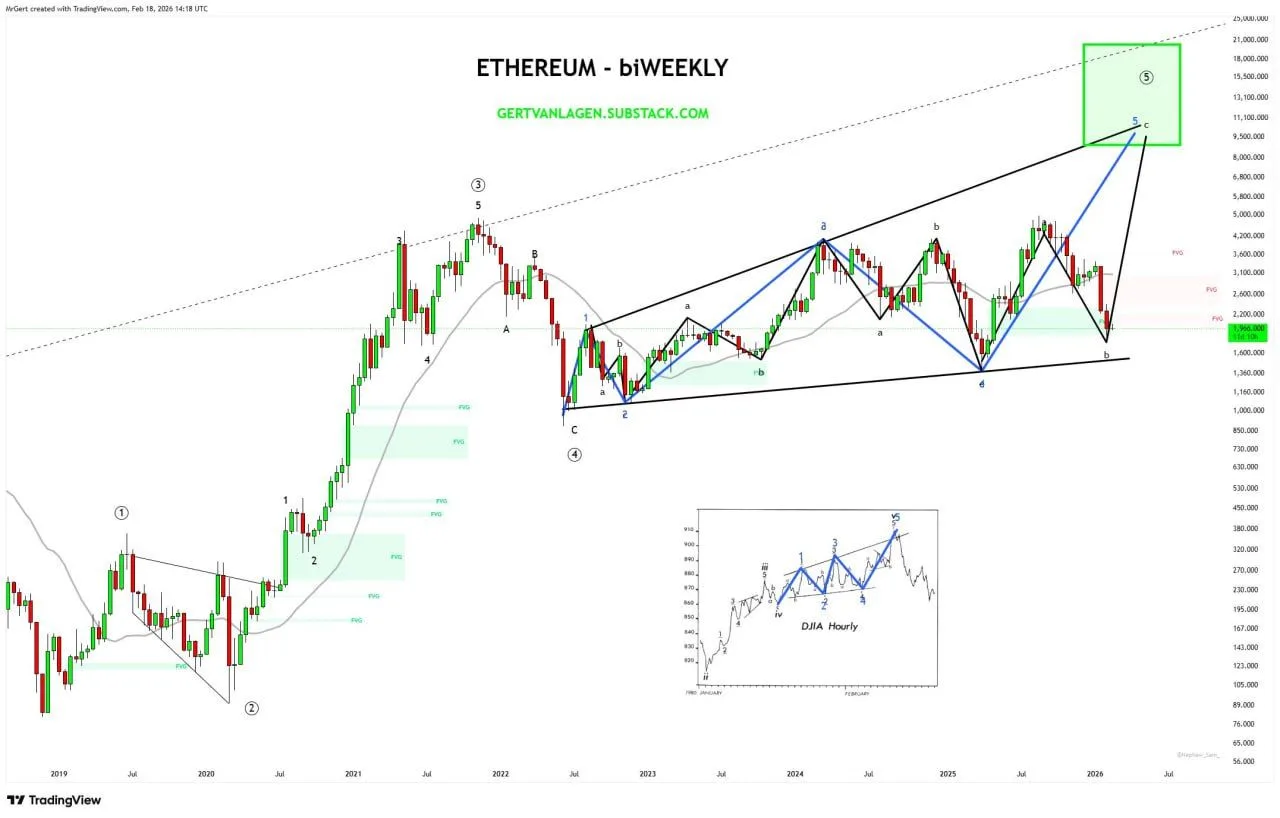
Ethereum biweekly chart. sauce: Gerd van Lagen of X
Van Lagen said that the next leg ⑤-5-b fell after Ethereum lost the simple moving average of the higher time frame. He added that the latest decline closed the fair value gap marked between approximately $1,800 and $2,300, a zone highlighted as a previous imbalance on the chart.
The analyst framed ⑤-5-c as a remaining upside push within the structure and set the expected target zone between $9,000 and $18,000. He set an invalidation on the break below the level labeled ⑤-4 on the chart. This would invalidate the count in his framework.
$ETH On the daily chart, the base is maintained below $2,000 due to short-term triangle formation.
Ethereum was trading around $1,972 on the daily ETHUSD chart as the price compressed into a narrow triangle below the $2,100 area. This pattern followed a sharp decline from the low $3,000s, followed by a push down to the lows while the lows slowly rose from the mid-$1,800s. This structure indicates short-term indecision as the price remains below previous support around $2,000 and is currently acting as resistance.
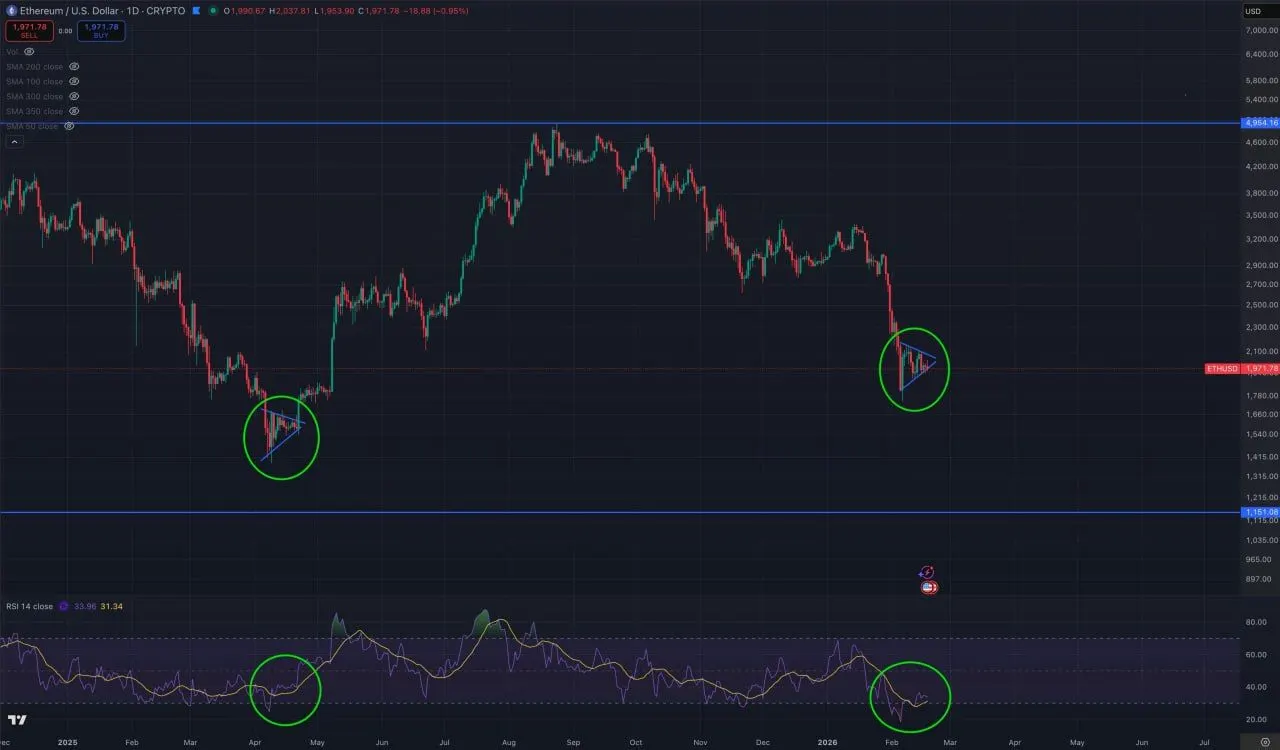
Ethereum USD 1D chart. sauce: Rendoshi on X
On the same chart, a previous swing showed a similar compression phase in early 2025, with prices resuming near resistance before resolving higher. Current settings are below a broad range that ranges from around $1,150 on the downside to $4,950 on the upside, levels marked as historical support and resistance on a daily basis. Prices remain well below the ceiling that has limited their rise since late 2024.
RSI momentum remained in the lower band, showing a slight rebound from readings below 30 as prices stabilized. While this indicator reflects the cooling of downward pressure after the recent decline, price action continued to record a tight candlestick near the top of the triangle. The chart highlights that it is repeatedly testing the same support zone without a clear break, leaving short-term direction unresolved while the market waits for a definitive move.