Bitcoin price today is trading in a zone where bearish momentum intersects with rising contrarian interest, with the market processing a controlled but sustained decline.
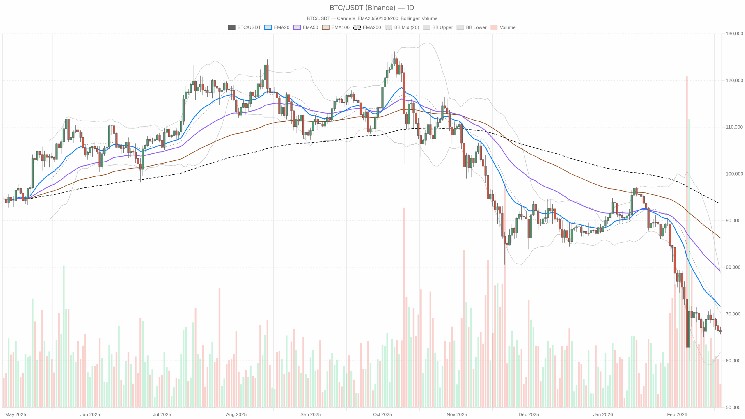
$BTC/$USDT — Daily chart including candlesticks, EMA20/EMA50, and volume.
1. Market theory – our current position
Bitcoin price today is trading around $66,100 – $66,200 ($BTC/$USDT) After weeks of controlled but relentless sales. The daily trend is clearly bearish, but the important thing here is that how It’s not due to panic, it’s been stable, and we’re now entering a level where the market would normally start to assert itself.
The current powerful forces are Risk-off positioning with large players After the Wall Street-led ETF wave subsides and macro/geopolitical tensions rise. You can see this in the headline, but you can also see it in the structure. Prices are well below the major moving averages, the RSI is depressed but not yet wiped out, and the Fear and Greed index is level. extreme fear (9). This is the part of the cycle where the trend following is still short or flat, but the contrarians are quietly starting to plan an entry, not because things look good, but because the situation ultimately looks unpleasant.
2. Higher time frame bias (daily – D1)
On daily charts, the system labels regimes as: bearish. The burden of proof is on the bull.
Price vs. EMA (trend structure)
- close: $66,139.49
- EMA 20: $71,578.15
- EMA 50: $79,127.61
- EMA200: $93,541.55
price is trading Significantly below all three EMAs. The short-term trend (20 EMA), medium-term trend (50 EMA), and long-term trend (200 EMA) are all above price, effectively acting as a stacked zone of overhead supply.
What it means: Structurally, we A mature pullback within a larger cycle bull market. Prices cannot fall much below the 200 EMA rising during the euphoric explosion. We see it during deep adjustments where late longs are wiped out. The distance to the 20 EMA and 50 EMA means that any bounce has room to execute before threatening the wider down leg.
RSI (Momentum/Exhaustion)
The daily RSI is located just above the classic oversold area.
What it means: The momentum is Bearish but not surrendering yet. Sellers are in control, but we are entering a zone where fresh shorts are at high risk of being squeezed. Our view is that the trend could fall a bit further, but unless we see another sharp decline, the risk reward will begin to shift against the newly established aggressive shorts.
MACD (trend momentum and inflection point)
- MACD line: -4,597.9
- Signal line: -4,926.81
- histogram: +328.91
The MACD is negative following a downtrend, but the histogram is positiveThis means that the MACD line is starting to move back towards the signal line.
What it means: Although the momentum of the trend is still waning, The rate of decline is easing. The bear is no longer accelerating its movements. They are trying to impose their existing advantages. This is often how base or short-term relief rallies begin. Instead of reversing immediately, it starts with a loss of downward momentum.
Bollinger bands (volatility and position)
- Middle band (20 SMA proxies): $70,266.69
- Upper band: $78,702.41
- Lower band: $61,830.96
- Price (closing price): $66,139.49
Bitcoin is traded on bottom half of bandbut not fixed to the lower band.
What it means: we, Volatility regime with downward biasbut there was no complete volatility explosion. Price has not reached the lower band. This indicates that the company is not in a linear liquidation stage. There is still room for a push towards the lower band nearby. 61.8 thousand dollars If sentiment deteriorates, there is room for the average value to return to around the mid-band. $70,000 If the seller loses concentration.
ATR (Daily Volatility)
Daily ATR is approx. $3.6 millionwhich is up by Bitcoin standards, but not extreme.
What it means: we, High but manageable volatility environment. The daily fluctuation range is thought to be around 5-6%. Position sizing should assume that intraday swings of $3-4,000 are the norm, not the exception.
daily pivot level
- Pivot point (PP): $66,363.77
- Resistance 1 (R1): $67,095.72
- Support 1 (S1): $65,407.55
The price is just sitting under Daily pivot points.
What it means: As long as the price is below, short-term control remains in the seller’s hands. 66.4 thousand dollars. The pivot acts as a daytime line on the sandy beach. While regaining the pivot with momentum suggests a short cover day, repeated rejections leave the path to that day open. 65.4 thousand dollars below.
3. Daytime situation – H1 and M15
Time frame (H1) – Confirmation of downtrend
- close: $66,148
- EMA 20: $66,716.85
- EMA 50: $67,161.95
- EMA200: $68,157.46
- RSI14: 37.35
- MACD line: -238.59
- MACD signal: -190.63
- MACD history: -47.96
- BB mid: $66,626.86 • Upper limit: $67,322.41 • Lower limit: $65,931.31
- ATR14: $395.62
- Pivot PP: $66,000.12 • R1: $66,368.4 • S1: $65,779.71
Prices will also increase in the first half of the year. below all major EMAsand the administration has been flagged as weak. The RSI is weak but not oversold and the MACD histogram is slightly negative.
What it means: The hourly chart is Consistent with daily downtrend. Sellers are still relying on intraday gains, but momentum is not in free fall. An hourly ATR of around $400 means that intraday fluctuations are typically around 0.5-0.7%, and hourly pivots are $66,000 It functions as a gravity point. 66. A brief spike above the pivot that breaks near R1 around $37,000 is a typical spot where short-term traders rejoin the general downtrend.
15 minutes (M15) – Execution layer
- close: $66,125.34
- EMA 20: $66,423.36
- EMA 50: $66,656.87
- EMA200: $67,192.10
- RSI14: 35.93
- MACD line: -236.28
- MACD signal: -178.2
- MACD history: -58.08
- BB mid: $66,513.08 • Upper limit: $67,212.48 • Lower limit: $65,813.68
- ATR14: $256.4
- Pivot PP: $65,992.56 • R1: $66,353.3 • S1: $65,764.61
M15 is showing moderate downside momentum with the price falling below the short EMA. The RSI is weak and the MACD histogram is negative but not collapsed.
What it means: The microstructure is managed sales More than panic. Although the push is selling, the rebound is not completely gone. For intraday traders, the band between the 15-minute pivot near $65,993 and R1 near $66,353 is a short-term battleground. Above R1, you begin to see signs of compression. Below the pivot, the path of least resistance is lower towards the bottom. 65.7 thousand dollars and daily S1 area.
4. Market Conditions: Dominance, Sentiment, and DeFi
$BTC Dominance is high at 56.18%Meanwhile, the market capitalization of virtual currencies has fallen by approx. 1.7% in 24 hours. fear and greed sit 9 (extreme fear).
What it means: Money does not rotate into altcoins. it sits on either $BTCmove to stablecoins or leave the space altogether. Extreme fear at these levels usually appears not at the beginning of the drawdown, but at a later stage. While it doesn’t guarantee rock bottom prices, here’s what you’ll find: More and more cases of forced sellers and late bears pushing the tape. The spike in DeFi fees for major DEXs, such as Uniswap v3, which spiked on the day, points to increased on-chain activity, coinciding with repositioning and risk aversion.
5. Main scenarios for Bitcoin price today
Based on daily trend structure and adjusted lower timeframes, Main scenario is bearish. However, it is characterized by a bearish environment in the late stages. Loss of momentum and growing fearthis is usually where the inflectional setting begins to form.
Bearish scenario (main)
In an active bearish trend, Bitcoin Unable to recover daily pivot of approximately $664,000 With authority. Every time we test the hourly resistance zone in and around the $67,000 area, we are hit by a sell-off. The H1 and M15 EMAs continue to constrain prices, causing the market to step down.
In this scenario:
- During the day, H1 S1 near $65,78,000 and daily S1 around $65,41,000 level are tested and may break.
- Volatility (ATR) maintains a sufficiently large daily fluctuation range, Bollinger bands fall to around $61.8k.
- The RSI is consistent with the recent news narrative that if we see a clean bar towards or slightly above $60,000, it could sink into the $25-30 zone on a daily basis, triggering a liquidation around that level.
Today, here’s what strengthens this scenario: It remains pinned below the intraday EMA cluster, with a more negative MACD histogram at H1 and M15, and no daily ATR pickup without a positive reaction from buyers.
Disable bearish scenario:
- persistent setback Over $70,000near the mid-daily Bollinger and 20 EMAs, would seriously damage the bearish theory for the time being.
- On the lower time frame, a series of highs and lows from the first half of the year are outperformed. $66.5 to $67,000 A band with the MACD crossing steadily positive and the RSI breaking above the mid-$50s would indicate that sellers have lost control of the short-term tape.
Bullish/Mean Reversal Scenario (Secondary)
The opposite scenario takes the following view. Extreme fear and slowing downside momentum We are setting up a relief rally instead of another waterfall. Here Bitcoin is Mid $65,000 It begins to rise during the day.
Under this path:
- Price regains daily pivot 66.4 thousand dollars And maintain above it on a closing price basis.
- The first upward magnet is Hourly Mid Bollinger and EMA Approximately $66.7-67.2 thousand, then around mid-daily Bollinger $70,000.
- The daily RSI is back above 40 and the MACD histogram for D1 remains positive and increases, indicating that the deceleration of the previous downtrend is more convincing.
This scenario is not a call for another macro bull market. it’s about pricing short cover rally And we’ll probably end up retesting the broken support level from above.
Disable bullish scenario:
- A nice break and end of the day About $61.8k, or a rapid flash towards $60,000, below Bollinger’s lower orbit Absent a strong buying reaction, the idea of mean reversion will be undermined and the door to a deeper correction will be reopened.
- If H1 repeatedly fails in the $66-67,000 zone and rolls over with increasing volume, the bounce case weakens quickly.
Neutral/Range Building Variations
There is a realistic middle path: Bitcoin could simply start Build range between approximately $62,000 and $70,000the volatility is compressed over time. In that case, the daily EMA will gradually fall, the price will depreciate sideways, and indicators such as RSI will remain in the 40-50 region.
Here’s what supports this: A decline in the ATR, a flat to slightly positive MACD histogram, and a series of failed breakouts and breakouts on either side of the range.
6. Positioning, risk and uncertainty
My current setup is: Trend followers still have an advantageBut their advantage is diminishing as momentum cools and emotions are gripped by extreme fear. The daily structure supports a bearish bias, but the indicators are clear. This is not the beginning of a downtrend. It is a more mature stage, where late-stage short sales and forced liquidations tend to compete with early push-buys.
The key to any proactive approach is to Adjusting the time frame:
- If you are leaning towards a bearish view, you would like to see H1 and M15 remain capped by the EMA and pivot, and the daily price stays below $70,000. A sharp push into these moving averages is a high risk zone to manage.
- If we are watching for a pullback, the first thing we look at is the price’s ability. Retrieve the pivot and hold it on toptoday begins to close the candlestick around $66-66.5 thousand, and above the first half short EMA.
Since the volatility is high enough, Position sizing and liquidity choices become more important than usual. A move of $3-4,000 one way or the other during a session is well within normal limits at this point, so a plan built on tight stops or overleverage is effectively betting on noise rather than direction.
Above all, this environment The story changes quickly. Just as a new wave of macro risk-off could emerge, if prices rebound strongly, the transition from extreme fear to passive optimism could occur in a few sessions. $BTC Towards a liquidation pocket of $60,000. The only constant here is uncertainty, so any directional stance must be combined with clear nullification levels and respect for the current volatility regime.