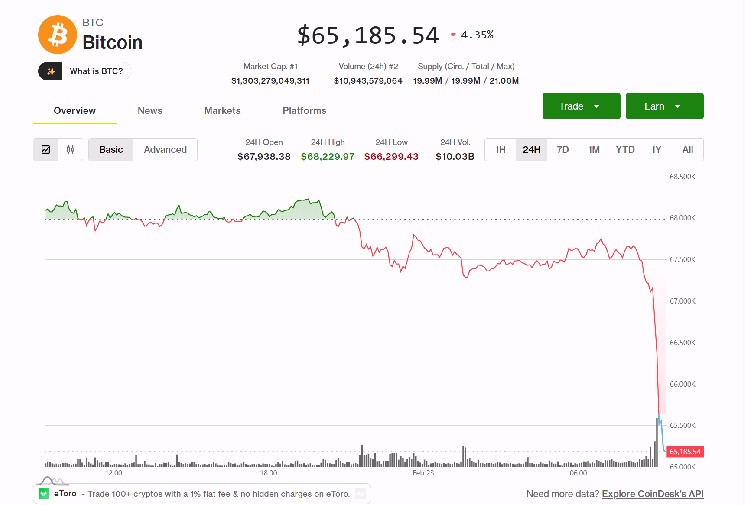
Bitcoin $BTC$67,996.25 Shares fell sharply at the start of the new trading week, dropping 5% in the past 24 hours to $64,700.
U.S. stock index futures also fell, led by the Nasdaq 100, which fell 0.9%. Precious metals are up significantly, with gold up more than 2% and silver up more than 5.6%.
Bitcoin’s move follows a sharp decline from the $67,000 level it was trading at over the weekend, and comes as on-chain data from Glassnode and CryptoQuant suggests the worst of the panic may be over, although the broader structure remains under pressure.
Glassnode data shows that recent Bitcoin buyers realized large losses earlier this month. The seven-day measure, which smoothes gains and losses for short-term holders, fell to -$1.24 billion per day on February 6. This means that new investors locked in losses totaling more than $1 billion every day.
The recent 7D-EMA of investors’ net realized gains and losses plummeted to -$1.24 billion/day on February 6, but has slowed to -$4.8 billion/day today.
Although the intensity has subsided, the broader regime shows the market is still under pressure and participants are in the foundation stage… https://t.co/rhCsrDuDfJ pic.twitter.com/00zibdP1om— Glassnode (@glassnode) February 23, 2026
This number has since improved to approximately -$480 million per day. In other words, panic selling has slowed, but it hasn’t completely stopped. Recent buyers are still selling at an overall loss, but this typically occurs during bottom formations rather than during strong uptrends.
Trade flow data from CryptoQuant paints a similar picture of changing market dynamics.
According to data from CryptoQuant’s latest weekly report, the amount of Bitcoin sent to exchanges has surged to around 60,000 $BTC In early February, the daily amount declined toward $60,000. That number has since fallen to about 23,000. $BTC On a 7-day smoothed basis, this suggests that the wave of immediate selling has subsided.
However, the person selling them has changed. CryptoQuant’s “Exchange Whale Ratio” rose to 0.64, its highest level since 2015. This means that nearly two-thirds of the Bitcoin flowing into exchanges comes from just the 10 largest deposits each day.
In other words, large holders, often referred to as whales, account for the bulk of the supply going to exchanges. The average size of each Bitcoin deposit has also risen to levels last seen in mid-2022, reinforcing the idea that larger players, rather than smaller retail traders, are driving current exchange activity.
Altcoins are facing wider circulation. Average daily exchange deposits for altcoins have increased from about 40,000 in Q4 2025 to about 49,000 so far in 2026, according to CryptoQuant data. Increased deposit activity across alternative tokens has historically coincided with increased volatility and decreased risk appetite.
Liquidity buffers are also thinning. USDT net inflows to exchanges plummeted from a one-year high of $616 million in November to just $27 million, according to CryptoQuant, and briefly turned negative in late January. Stablecoin inflows typically expand during rallies. Their contraction suggests a decline in marginal purchasing power.
Taken together, Glassnode’s loss realization data and CryptoQuant’s trading indicators indicate that the market is digesting the capitulation event but has not yet rebuilt strong demand.
As the week begins, the key question is whether the $65,000 level holds as a near-term pivot; $BTC A long foundation-building phase continues.