As of 8 a.m. ET on Sunday morning, Bitcoin was trading between $67,926 and $68,022, compressed just below a key resistance band, while momentum indicators were quietly shifting behind the scenes. While the broader structure remains corrective, short-term price movements suggest the volatility is far from over in the headlines.
Bitcoin chart outlook
At a macro level, Bitcoin’s daily chart reflects a strong correction from around $97,000 to a yield low near $59,930, followed by stabilization in the $66,000 to $70,000 range. While prices continue to make new highs, volume has declined during the consolidation, indicating contraction rather than expansion.
Major support is $65,000, with a breakdown level of $59,900. Overhead resistance remains solid between $70,000 and $72,000, and only a decisive daily close above $72,000 would confirm the structural high. Until then, the daily bias remains neutral to bearish, not dramatic, just disciplined.
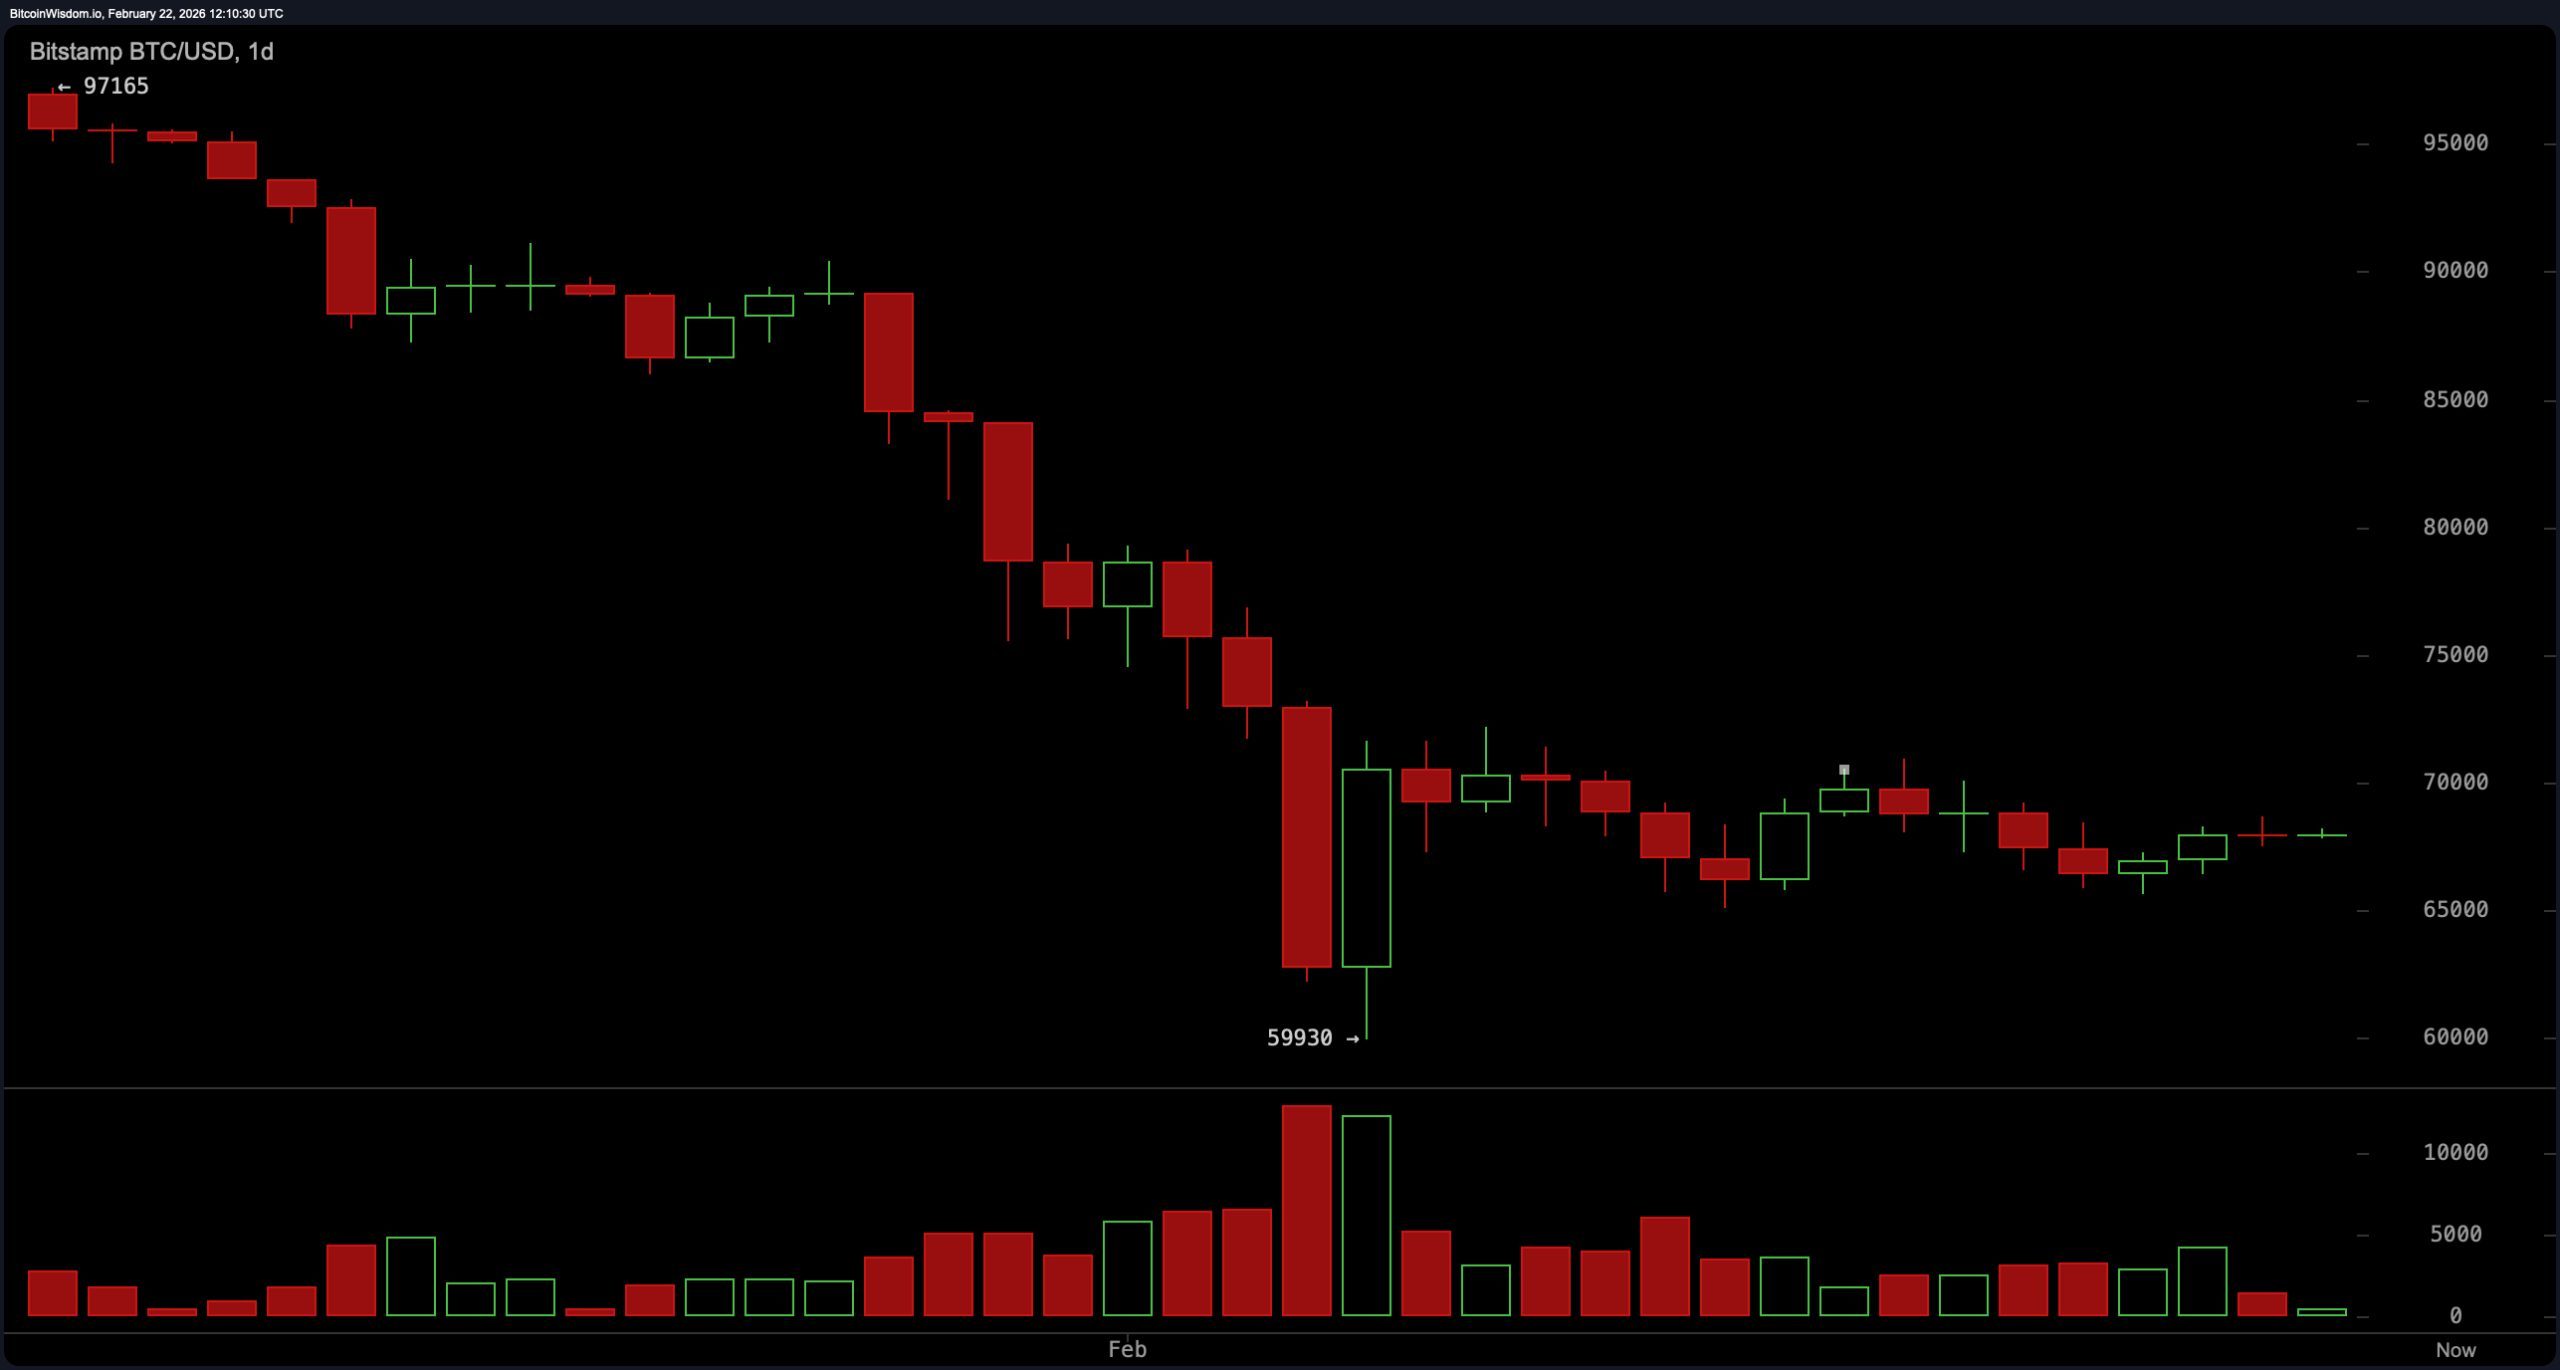
$BTC/USD 1-day chart via Bitstamp on February 22, 2026.
On the 4-hour chart, Bitcoin showed a measured recovery from $65,620, cutting higher lows before climbing the stairs to the $68,500-$69,000 area. However, the momentum is slowing near the resistance. This structure sees compression below $70,000 and is heavy on overhead supply. A sustained rally from $69,500 to above $70,000 could expose $72,000 and even $74,000, but a rejection in this zone increases the likelihood of a rotation back towards $66,000 and possibly $65,000. In other words, the 4-hour time frame reflects a range-bound recovery within a broader correction environment, which is optimistic, but remains a drag.
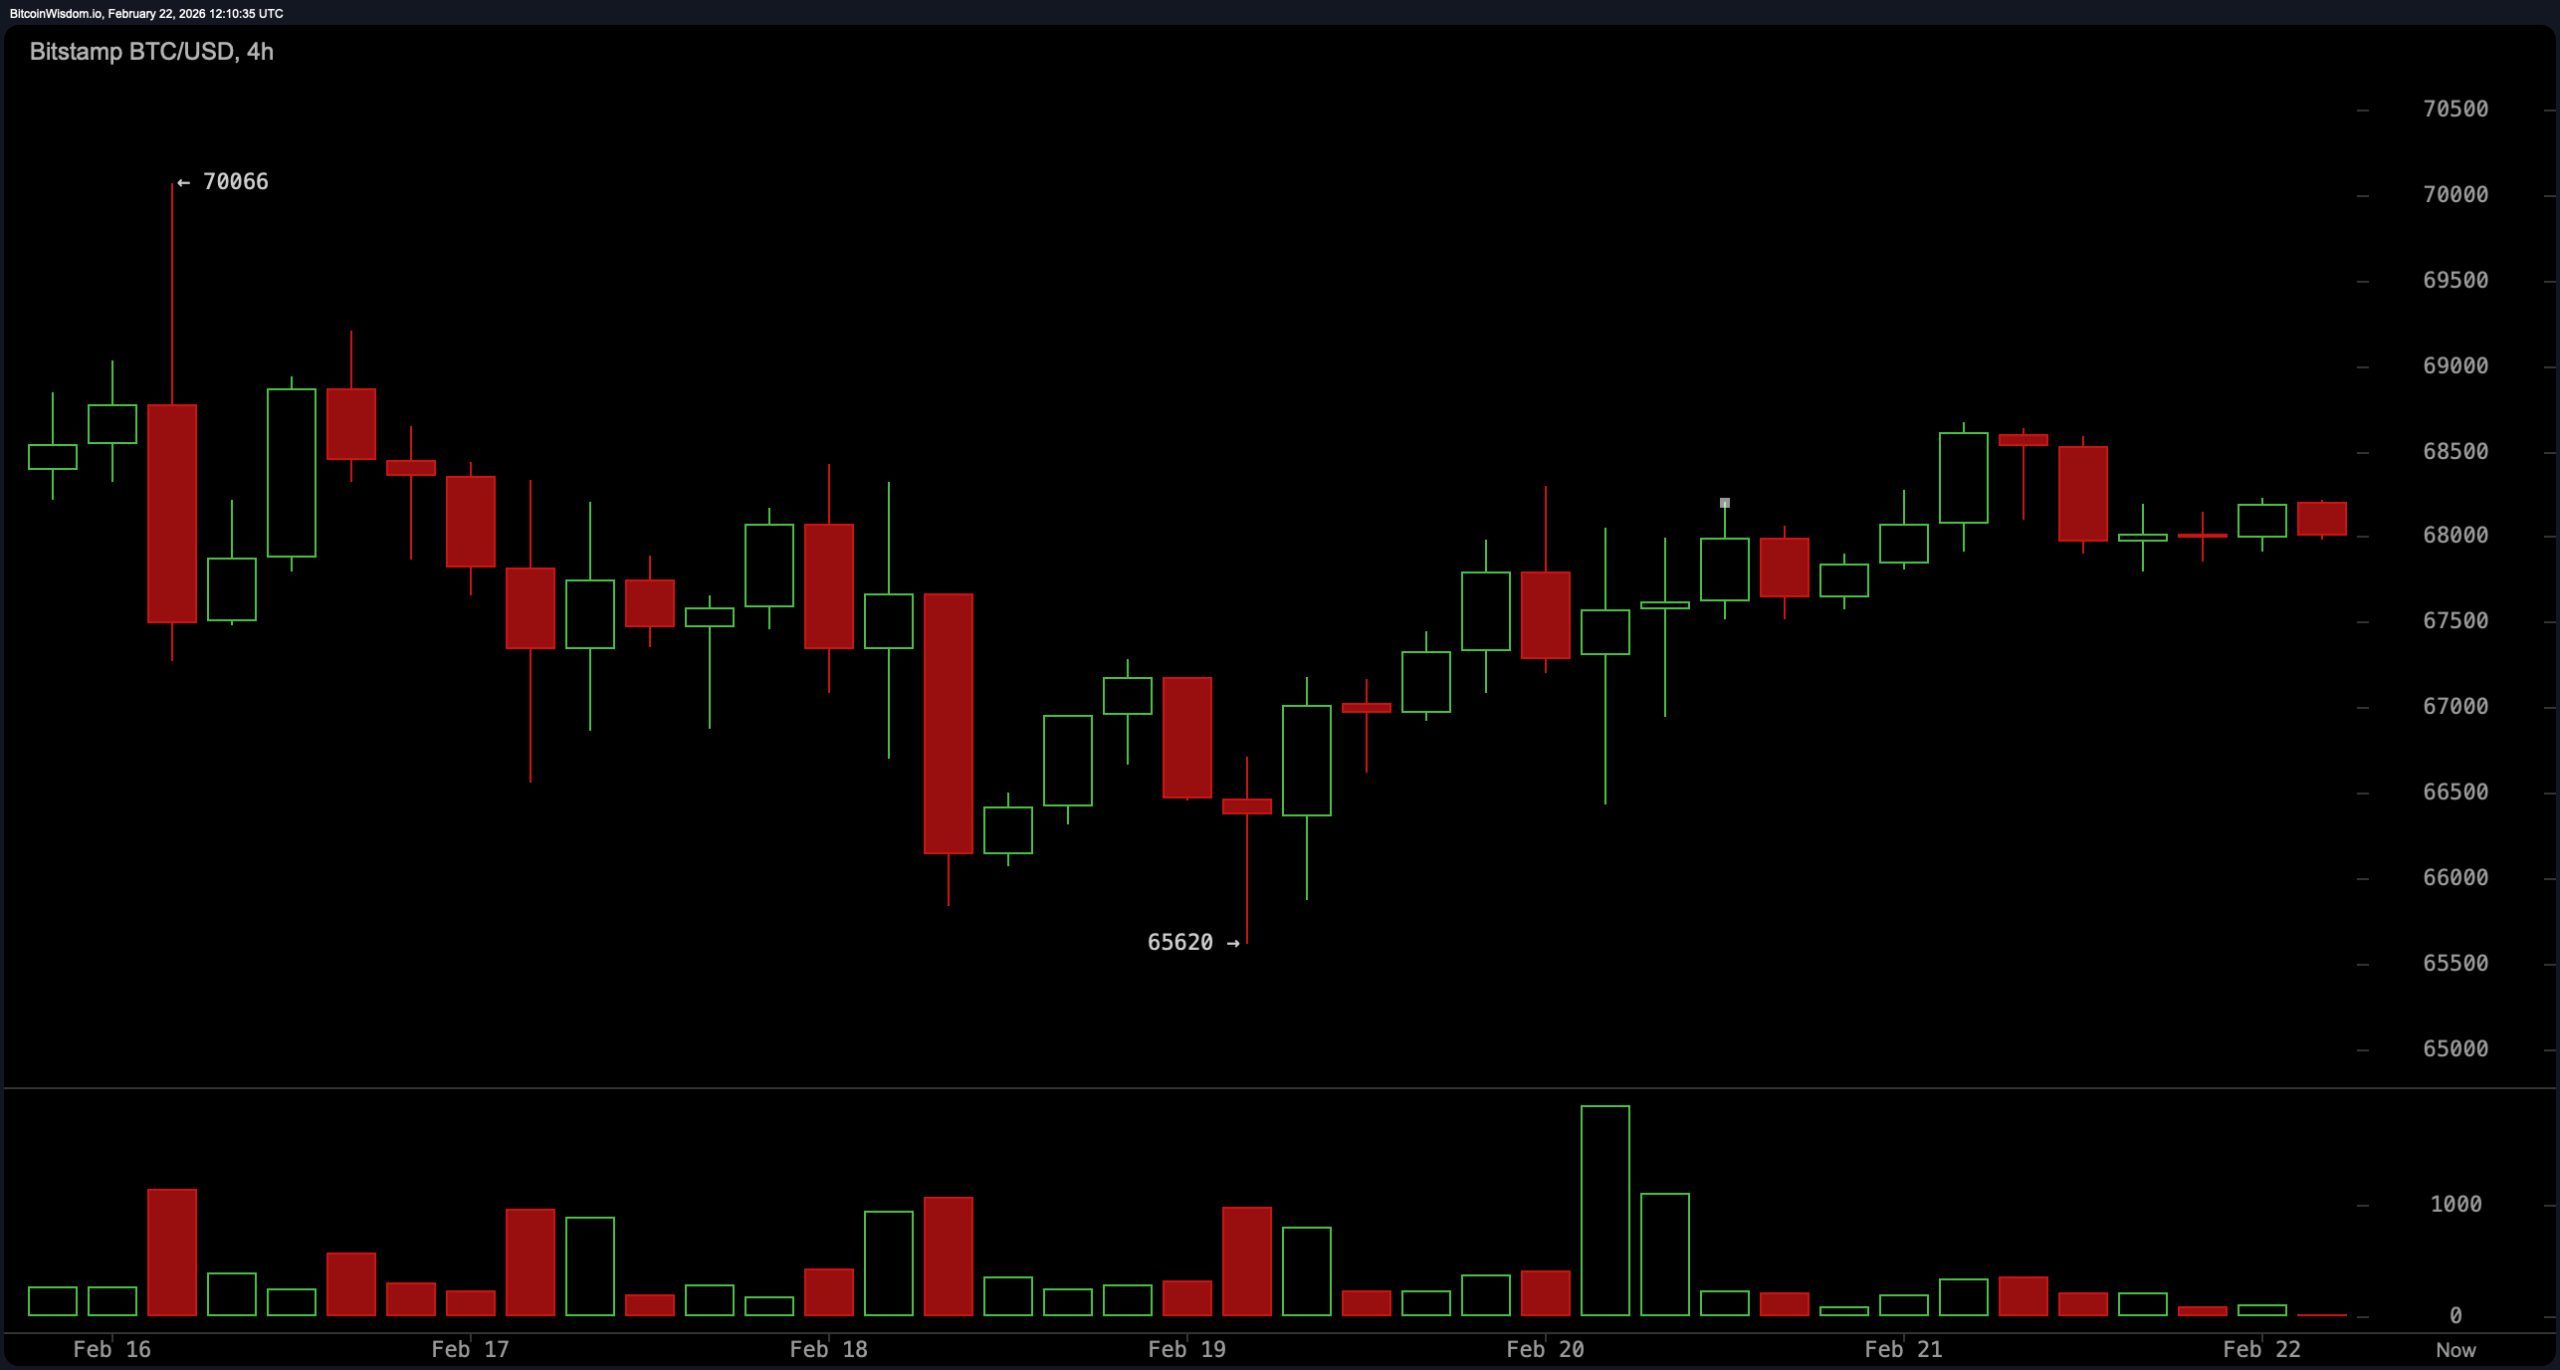
$BTC/USD 4-hour chart via Bitstamp on February 22, 2026.
The hourly chart captures the current characteristics of the market, namely the tight consolidation between $67,800 and $68,800. Multiple failures of the push above $68,800 would confirm active resistance, while consistent defense at $67,800 would establish short-term support. Volatility is decreasing, suggesting an expansion is occurring. A break above $69,000 will likely accelerate momentum to quickly test $70,000. Conversely, a loss at $67,800 opens the door to a retracement to deeper intraday support. Compression markets reward patience. Impulsive trading here tends to produce regret.
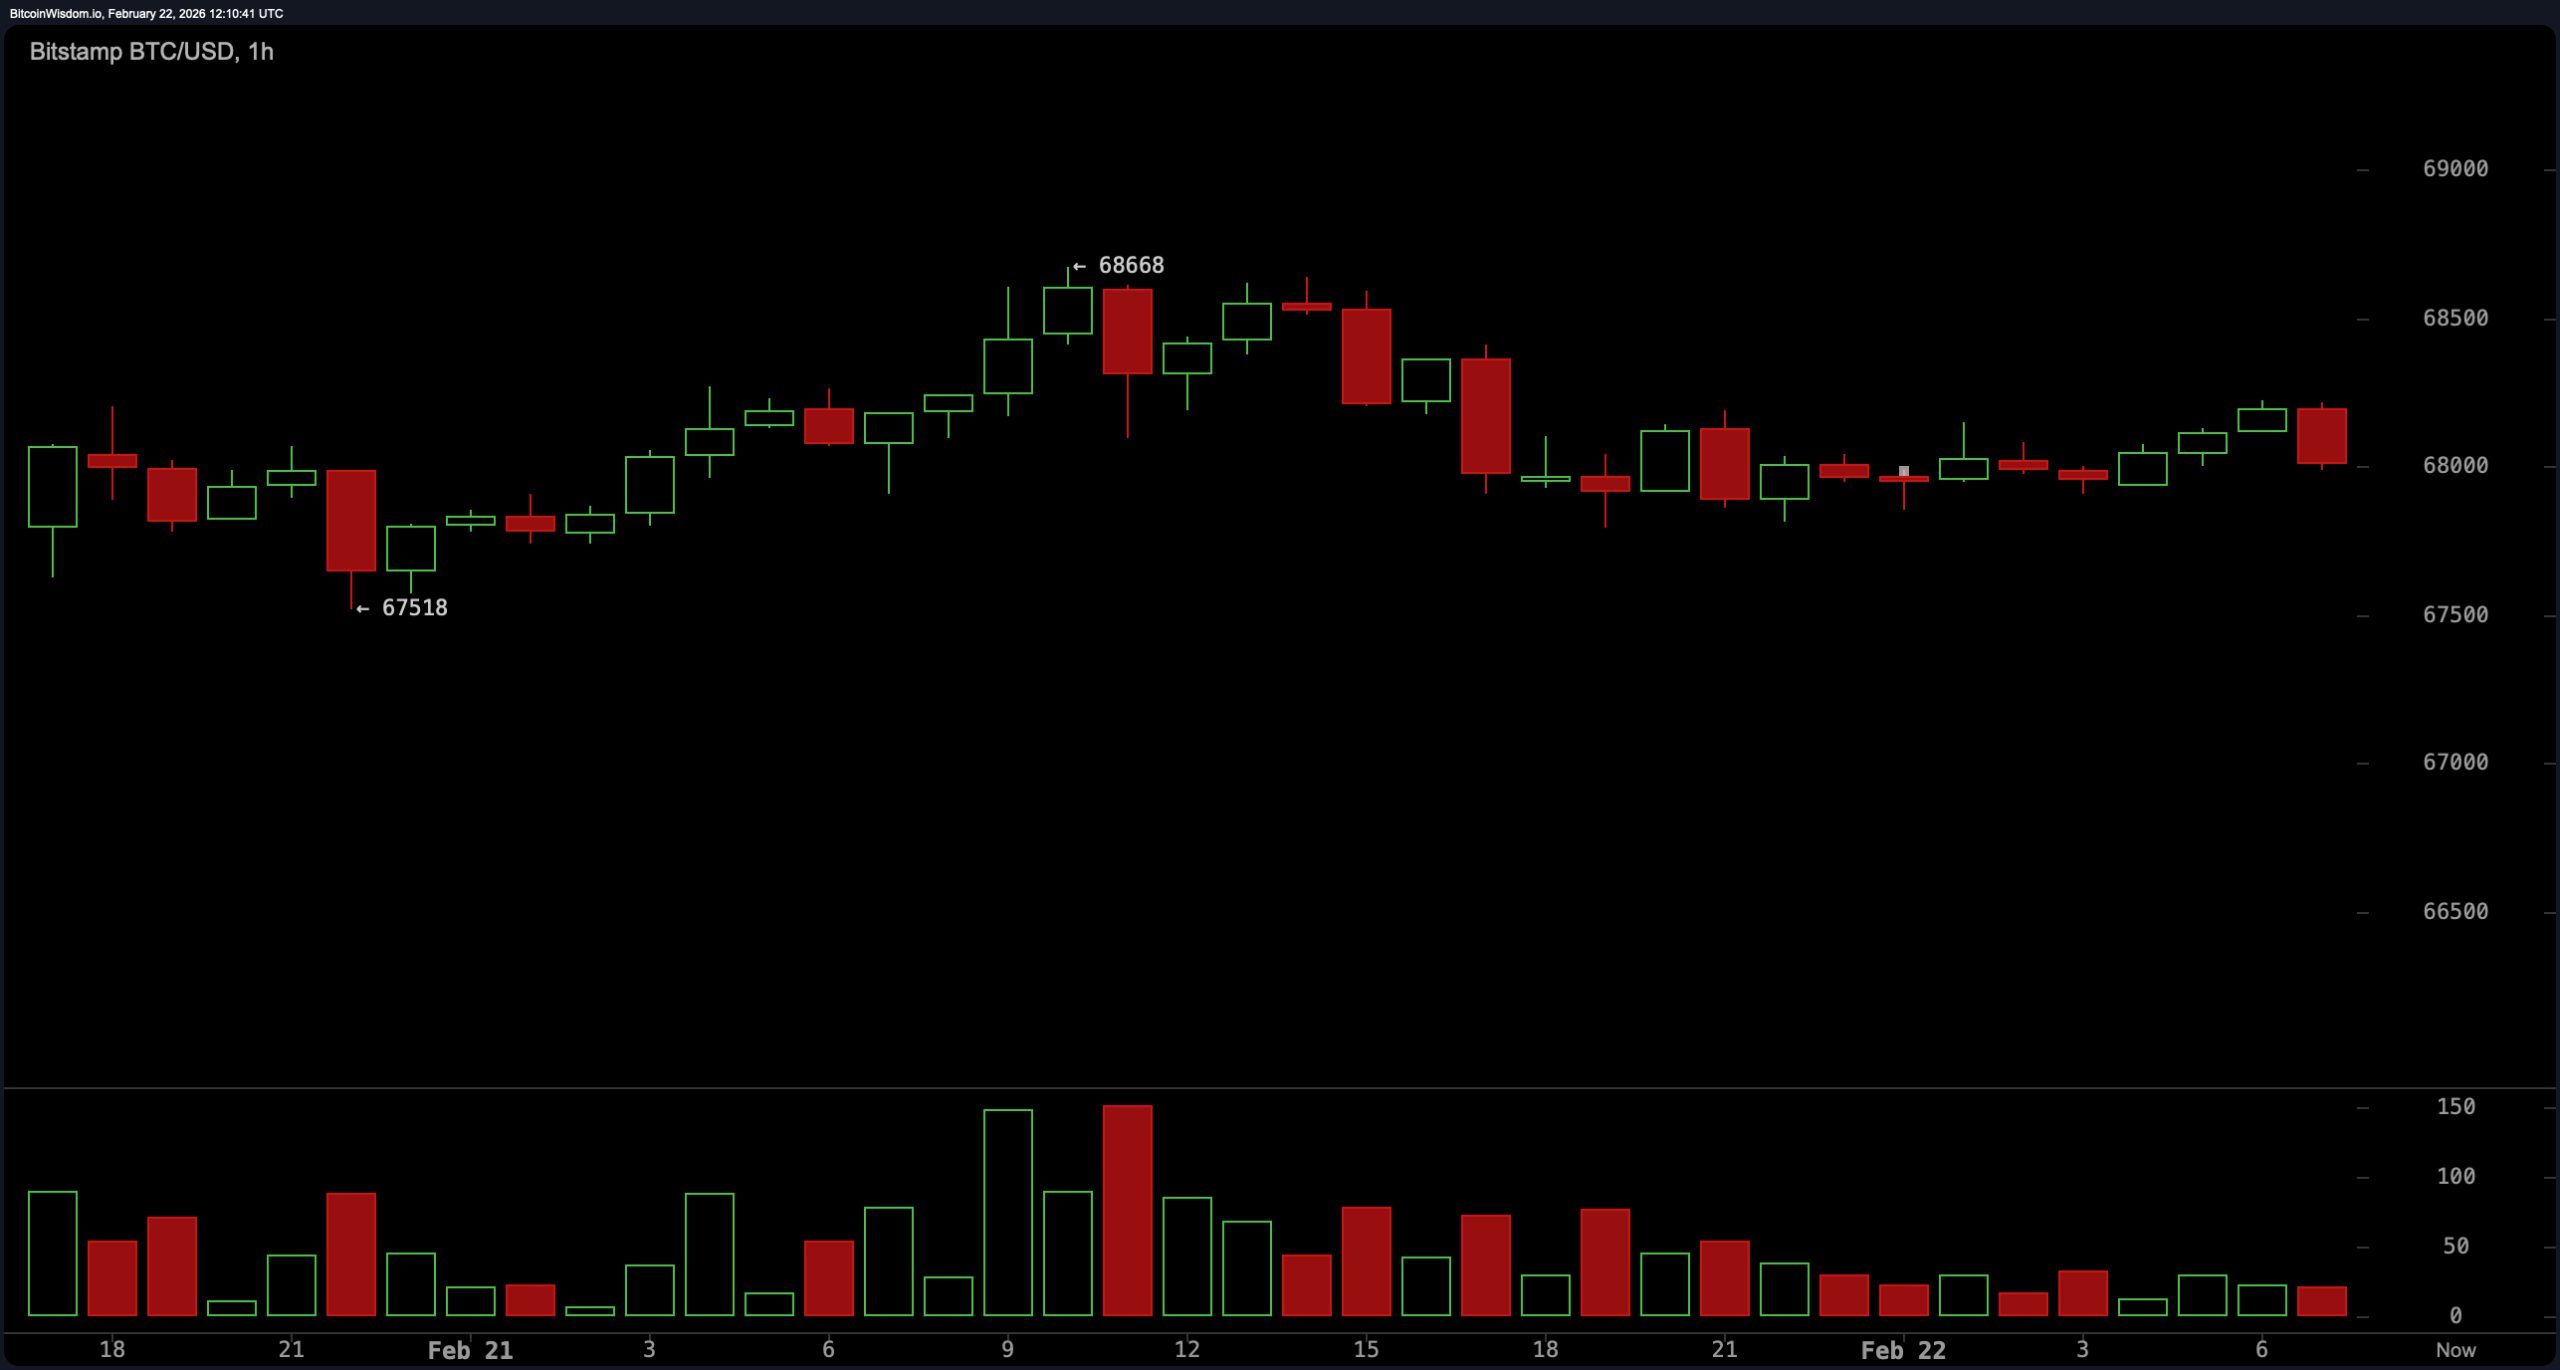
$BTC/USD 1-hour chart via Bitstamp on February 22, 2026.
The oscillator is mostly neutral, mainly indicating market indecision. The Relative Strength Index (RSI) is reading 37, the Stochastic Oscillator is reading 43, and the Commodity Channel Index (CCI) is reading -32, all neutral. An average directional index (ADX) of 57 indicates strong trend strength, although the direction itself is still debatable. Awesome Oscillator registers -8,510, while Momentum registers 1,787. The Moving Average Convergence Divergence (MACD) level is at -3,772. Despite the positive momentum measurements chosen, the broader oscillator suite reflects balance rather than dominance.
However, the moving average (MA) is definitely on a downward trend. The $68,233 exponential moving average (EMA) and $68,105 simple moving average (SMA) are both above the current price, reinforcing near-term resistance. The EMA (20) is $70,664 and the SMA (20) is $68,733, limiting further upside attempts. Higher timeframe averages accumulate overhead: EMA (30) $73,436. SMA (30) $73,991; EMA (50) $77,840; SMA (50) $81,309; EMA (100) $85,180; SMA (100) $85,300; EMA (200) $92,321; SMA (200) $98,930. It’s not light-tight, it’s a reinforced concrete ceiling.
Overall, Bitcoin is in a compression regime limited by support at $65,000 and resistance between $70,000 and $72,000. The daily structure remains corrective, the 4-hour chart shows a recovery within constraints, and the 1-hour chart is tightly wound. If the price can break above $72,000 with strong trading volume, the outlook will change dramatically. Until then, we will continue to see a range trading environment where discipline outweighs bravado, and the next round of volatility appears to be closer than it seems.
Bullish verdict:
A confirmed daily close above $72,000, supported by increased volume, would invalidate the current set of lows and establish a new structural high. Such a move would decisively change the momentum to an upside continuation, paving the way for $74,000 and indicating that the compression phase has resolved towards trend expansion.
Bear verdict:
A sustained loss of the $65,000 support could strengthen the broader correction structure, especially as downside volume accelerates, increasing the likelihood of a liquidity sweep towards $63,000 and potentially pushing the previous panic low to near the $59,900 area. Unless the $70,000-$72,000 resistance is regained, the macro bias remains vulnerable to renewed downside pressure.
Frequently asked questions 🔎
- What is the price of Bitcoin on February 4, 2026? Bitcoin is trading at $68,022, stabilizing below the $70,000 resistance level.
- What are Bitcoin’s major support and resistance levels currently? The main support lies at $65,000 and resistance lies between $70,000 and $72,000.
- What does the daily chart show about Bitcoin trends? The daily structure remains corrective unless Bitcoin definitively closes above $72,000.
- Are technical indicators bullish or bearish for Bitcoin? Although the oscillator is almost neutral, the moving average is still sitting above the price, indicating overhead pressure.