
Ethereum is navigating a period of increased volatility and uncertainty as it hovers around the $2,000 threshold. Recent price action suggests temporary stabilization after several weeks of selling pressure, but conviction remains limited. Rather than a confirmed support, the $2,000 level is acting as a psychological battleground where short-term positioning, liquidity conditions and sentiment clash.
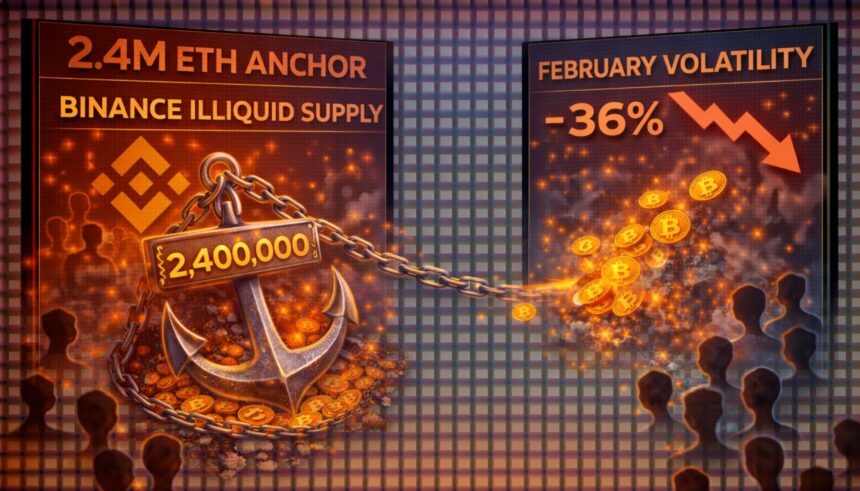
Arab Chain’s recent analysis provides additional structural insights through the ETH Binance Liquid and Illiquid supply models. This framework separates the Ethereum held on Binance into a liquid supply (coins that are readily available for trading) and an illiquid supply that is likely to move relatively less in the short term. As of February, Binance’s total ETH holdings were approximately 3.57 million ETH. Of these, approximately 1.16 million ETH are classified as liquid supply and 2.4 million ETH are classified as illiquid.
This distribution is important. A relatively small liquidity component may limit immediate sell-side pressure, but it does not eliminate risk if sentiment worsens. Conversely, a large illiquid base may reflect long-term holding behavior or strategic positioning rather than imminent distribution.
As soon as the price hovers near a major technical center, the composition of exchange reserves becomes a meaningful variable in assessing Ethereum’s next structural move.
Liquid versus illiquid supply represents a fragile balance.
Binance’s current reserve composition suggests that Ethereum is operating within a structurally balanced environment and not in an immediate deployment phase. As most of the 3.57 million ETH held on the platform are in illiquid supply, a significant portion of the coins appear to be relatively dormant. Illiquid balances are typically associated with longer holding periods or reduced trading frequency, which tends to dampen immediate sell-side pressure.

This is important at a time when ETH is hovering near $2,000. The predominantly illiquid holdings mean that most holders are not actively positioning for a quick exit. In previous cycles, rapid increases in liquidity supply often preceded spikes in volatility as coins became readily available for market execution. The dynamics are not yet clear at scale.
In contrast, liquidity provision historically expands during the speculative phase when traders aggressively rotate capital or prepare directional exposure. The lack of significant expansion means that speculative intensity is suppressed for now.
A relatively stable gap between liquid and illiquid supply indicates a balance between holding behavior and active trading. However, this balance is conditional. Any meaningful shift towards higher liquidity provision will increase the probability of volatility occurring again. Conversely, continued illiquidity dominance can help absorb price shocks and moderate downward acceleration.
Ethereum tests long-term support as downtrend accelerates.
Ethereum is under structural pressure, with its price hovering near the $2,000 area following a sharp collapse in the $3,200-$3,400 area. The weekly chart shows a clear loss of bullish structure, with lower highs forming after the late 2025 high and momentum turning decisively to the downside.

The price is currently trading below the 50-week moving average and the 100-week moving average, with both moving averages flattening out or starting to decline. This configuration usually signals that intermediate momentum is weakening and transitioning into a correction phase. Notably, Ethereum briefly tested levels around $1,800 before rebounding, suggesting there is reactive demand in that pocket of liquidity. However, the recovery remains limited and has not yet recovered the major moving averages.
The 200-week moving average located at the bottom of the chart is still in an upward trend, indicating that the macro trend has not completely reversed. Historically, this level has served as strong structural support during deeper cyclical corrections. If downward pressure resumes, this could be an important area to monitor.
Volumes increased significantly during the recent sell-off, reflecting a forced positioning adjustment rather than a gradual distribution. Since then, activity has eased, indicating a temporary stabilization.
Featured image from ChatGPT, chart from TradingView.com
editing process for focuses on providing thoroughly researched, accurate, and unbiased content. We adhere to strict sourcing standards and each page undergoes diligent review by our team of top technology experts and seasoned editors. This process ensures the integrity, relevance, and value of the content for readers.