
Bitcoin traded at $68,269 at 8:00 a.m. ET on February 26, 2026, bucking stubborn resistance that continues to dictate the short-term trend. The structure is constructive, momentum is about to change direction, and price is hovering in what experienced traders call the decision zone.
Bitcoin chart outlook
On the daily chart, Bitcoin’s broader structure continues to correct within a larger uptrend. Prices previously fell from around $93,000 to nearly $59,900, with demand decisively entering before a foundation was formed. Since then, the lows have risen further and the current zone is centered between $67,000 and $69,000.
The intraday remains clear, with primary support at $60,000, secondary support between $63,000 and $65,000, and resistance well defined between $70,000 and $72,000. A daily close above $72,000 opens the door to $78,000 to $80,000, while repeated rejections near $70,000 risk a slide back toward the mid-$60,000s. The bias remains constructive, but only if the primary level is maintained.
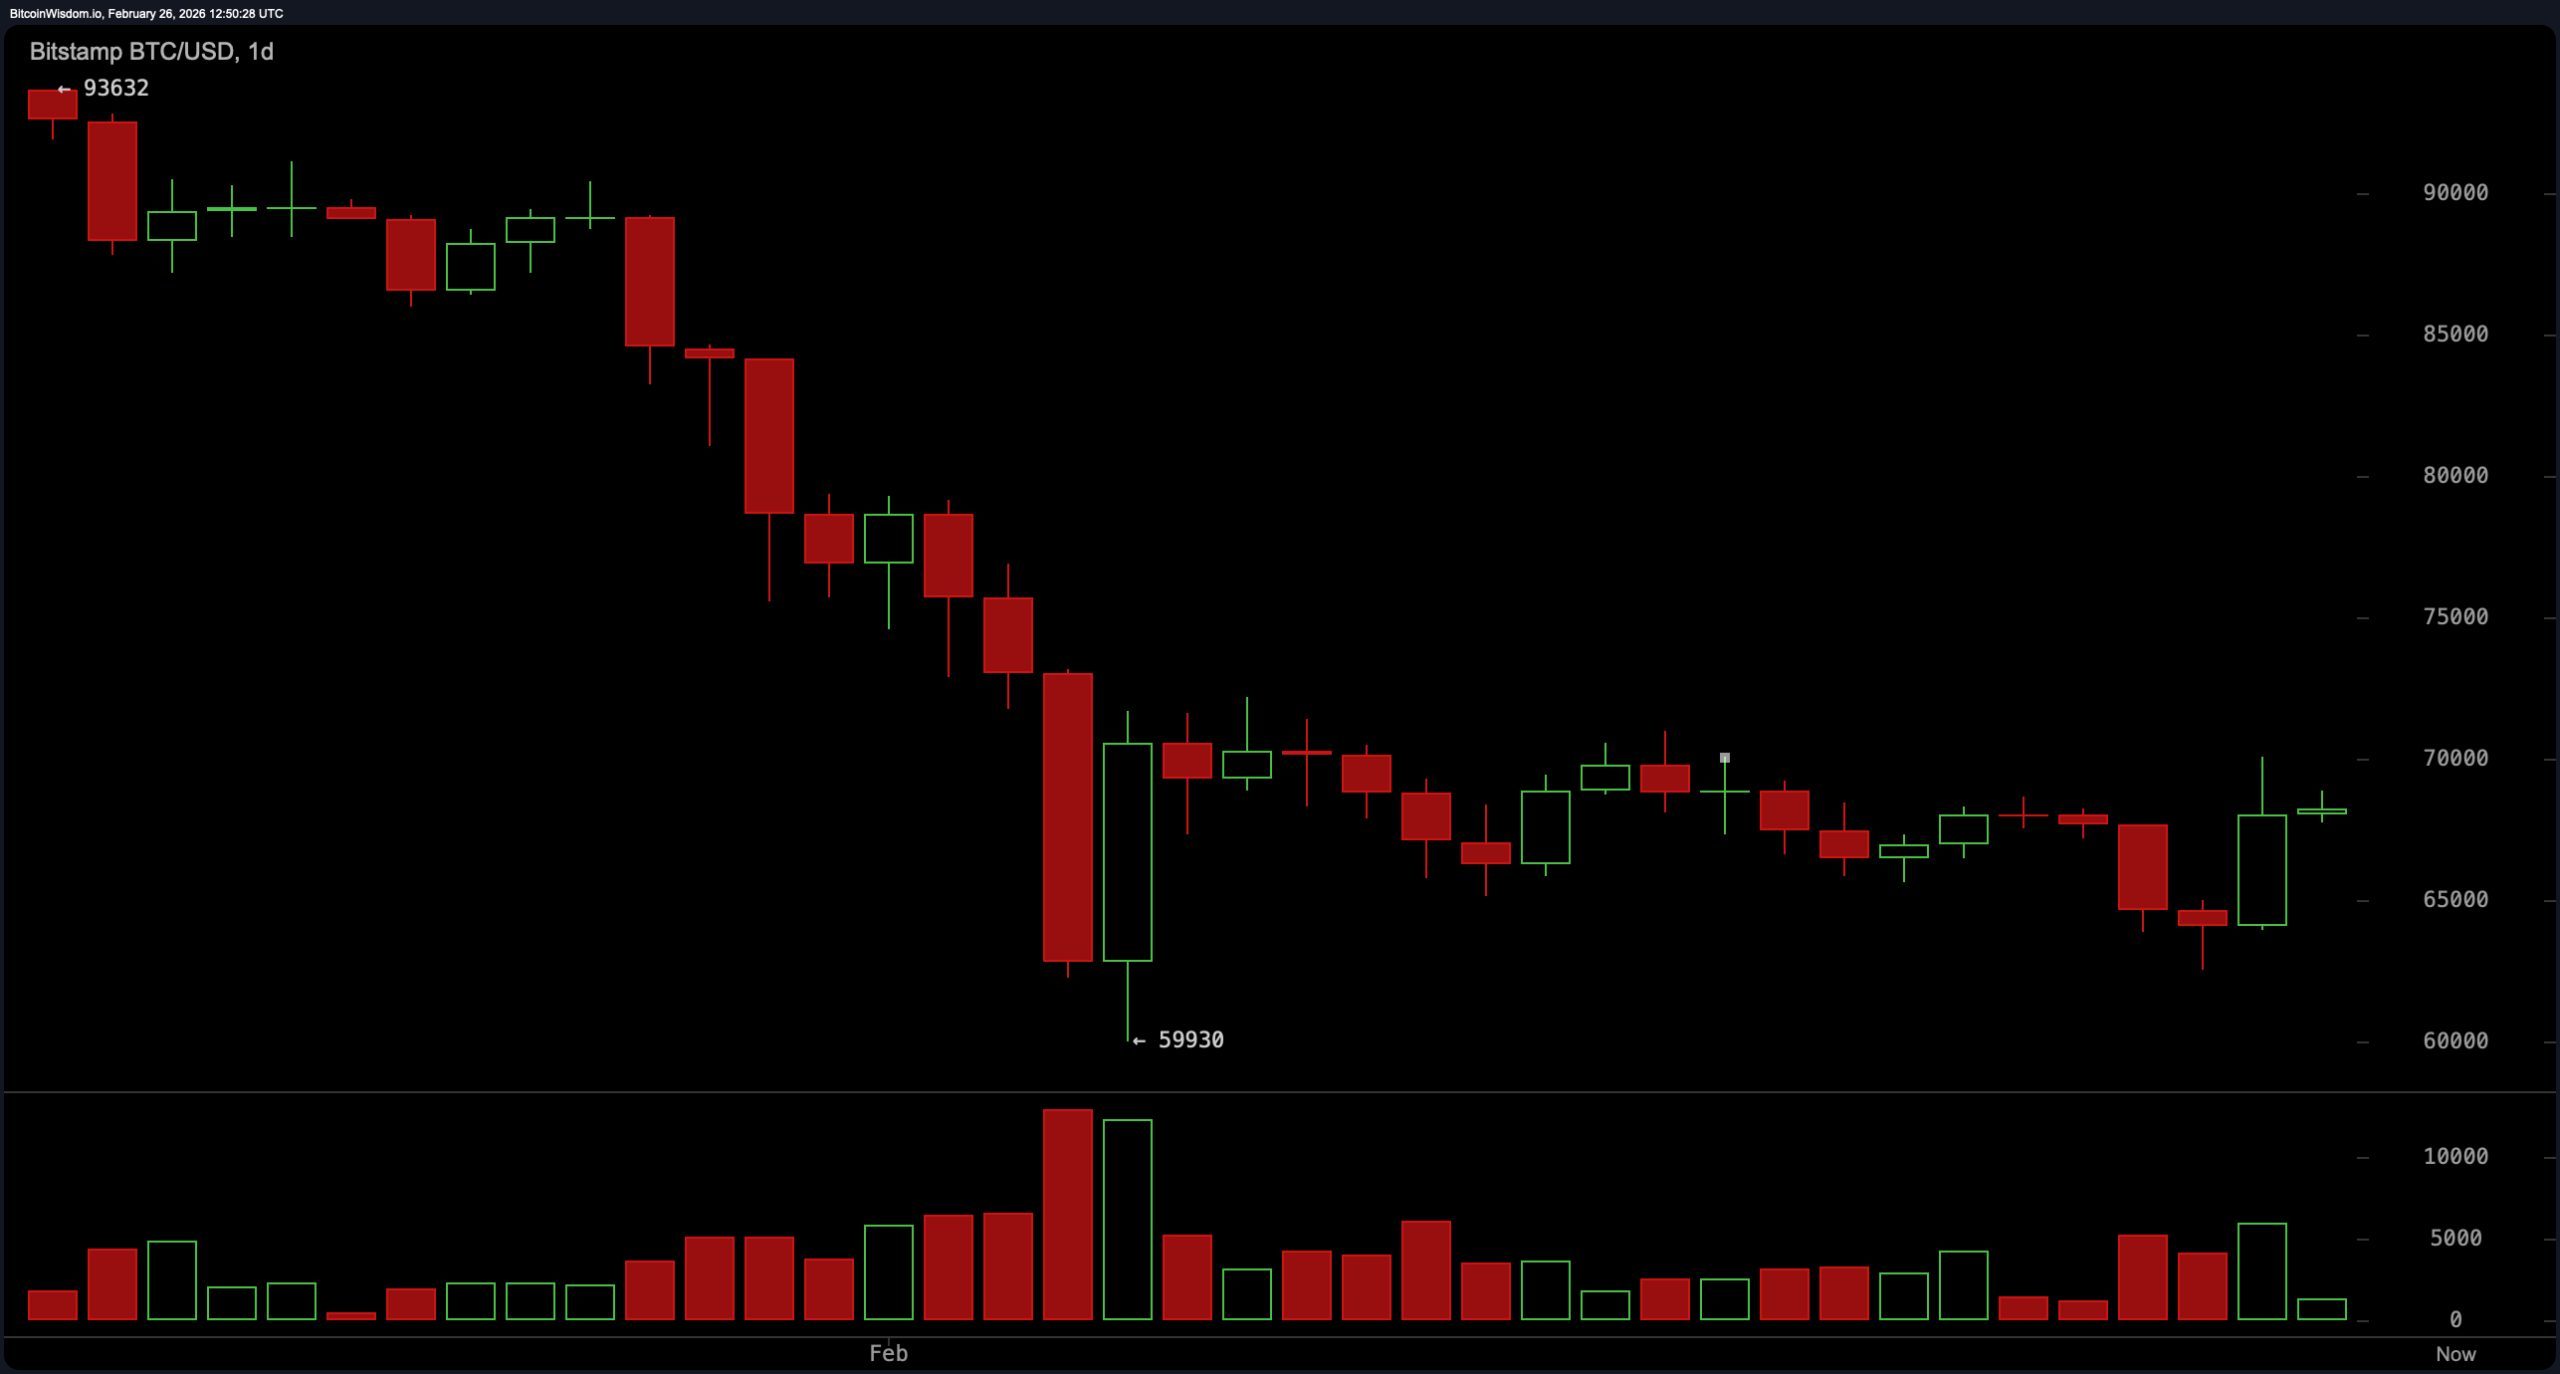
$BTC/USD 1-day chart via Bitstamp on February 26, 2026.
The 4-hour Bitcoin chart shows a V-shaped recovery from $62,500 to $70,038, followed by a controlled decline rather than a chaotic selloff. Highs and lows continue to form, and the momentum is cooling down without reversing. Intraday support lies between $67,000 and $68,000, with $65,000 providing stronger footing. The $70,000 resistance level has been repeatedly respected, with a sustained four-hour close above that level that has technical pivot traders keeping an eye on it. Until then, this is a structural integration under the ceiling and will not budge.
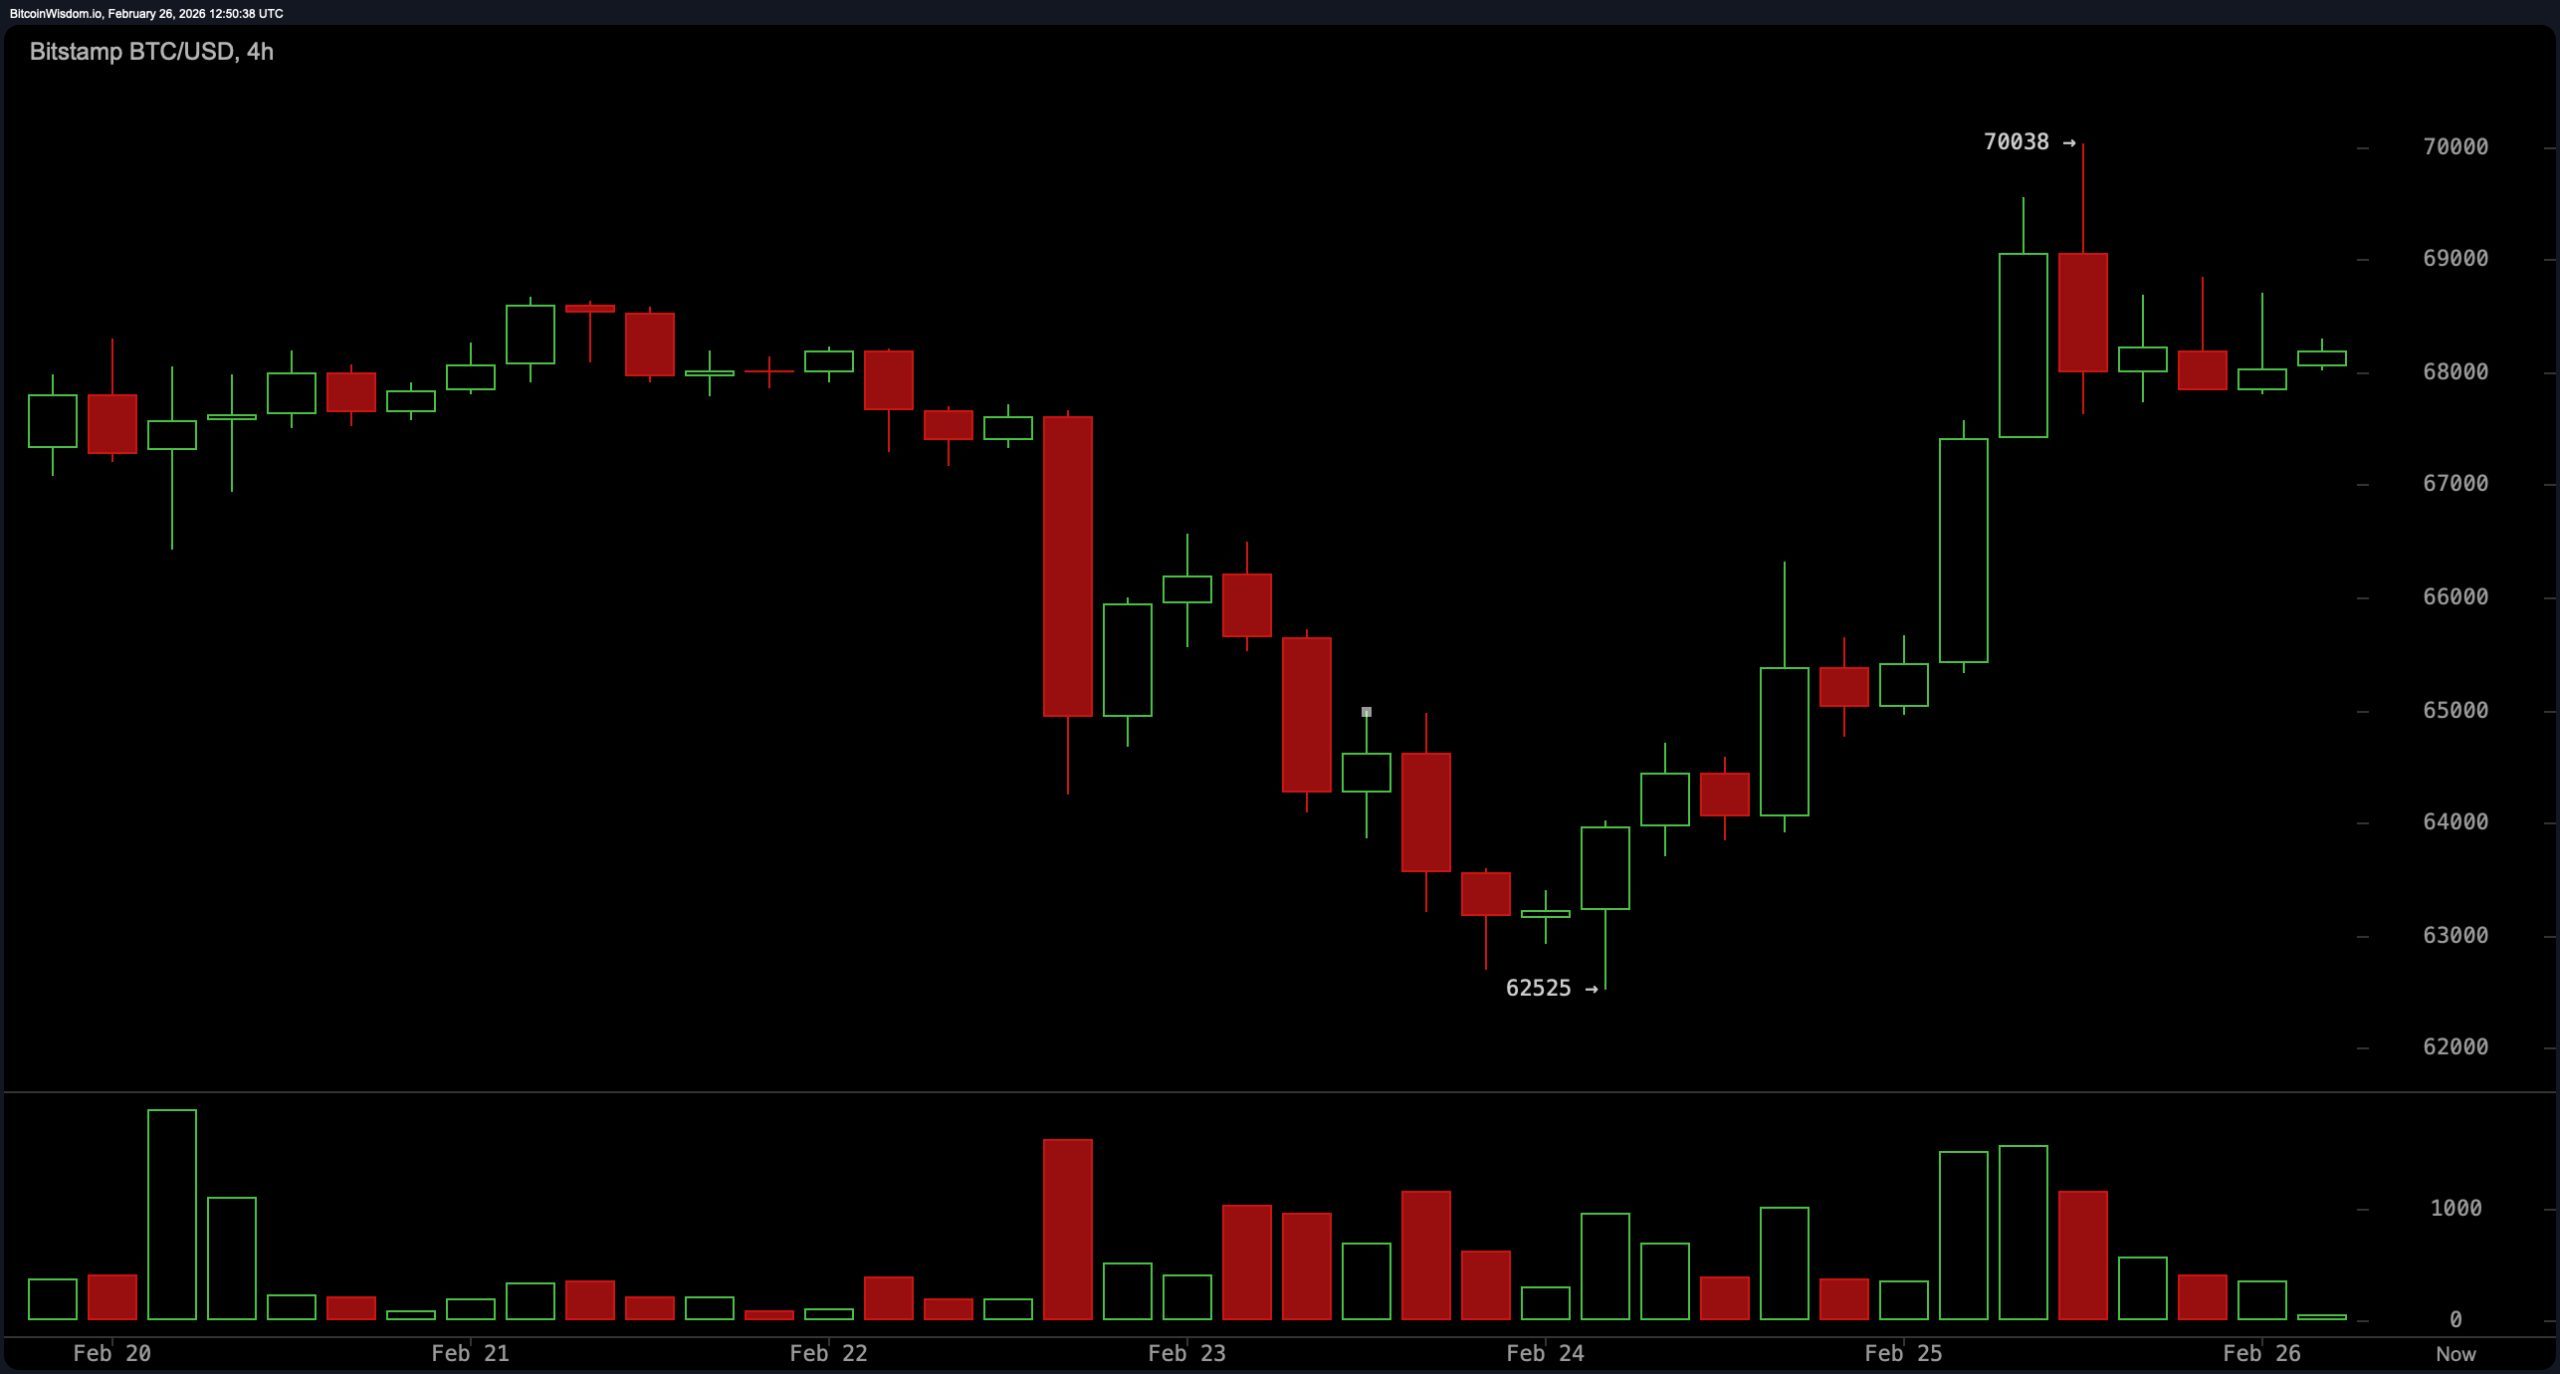
$BTC/USD 4-hour chart via Bitstamp on February 26, 2026.
On the hourly time frame, Bitcoin is compressing sideways below resistance after rallying from around $63,800 to $70,000. The current $68,000 to $69,000 range is often a precursor to more volatility as volume declines. Comparable highs around $69,500 to $70,000 suggest liquidity is just above it, while the low of the range is near $67,800, and a break below $67,500 presents bankruptcy risk. This is classic coil behavior and tends to resolve confidently once fluidity is ensured.
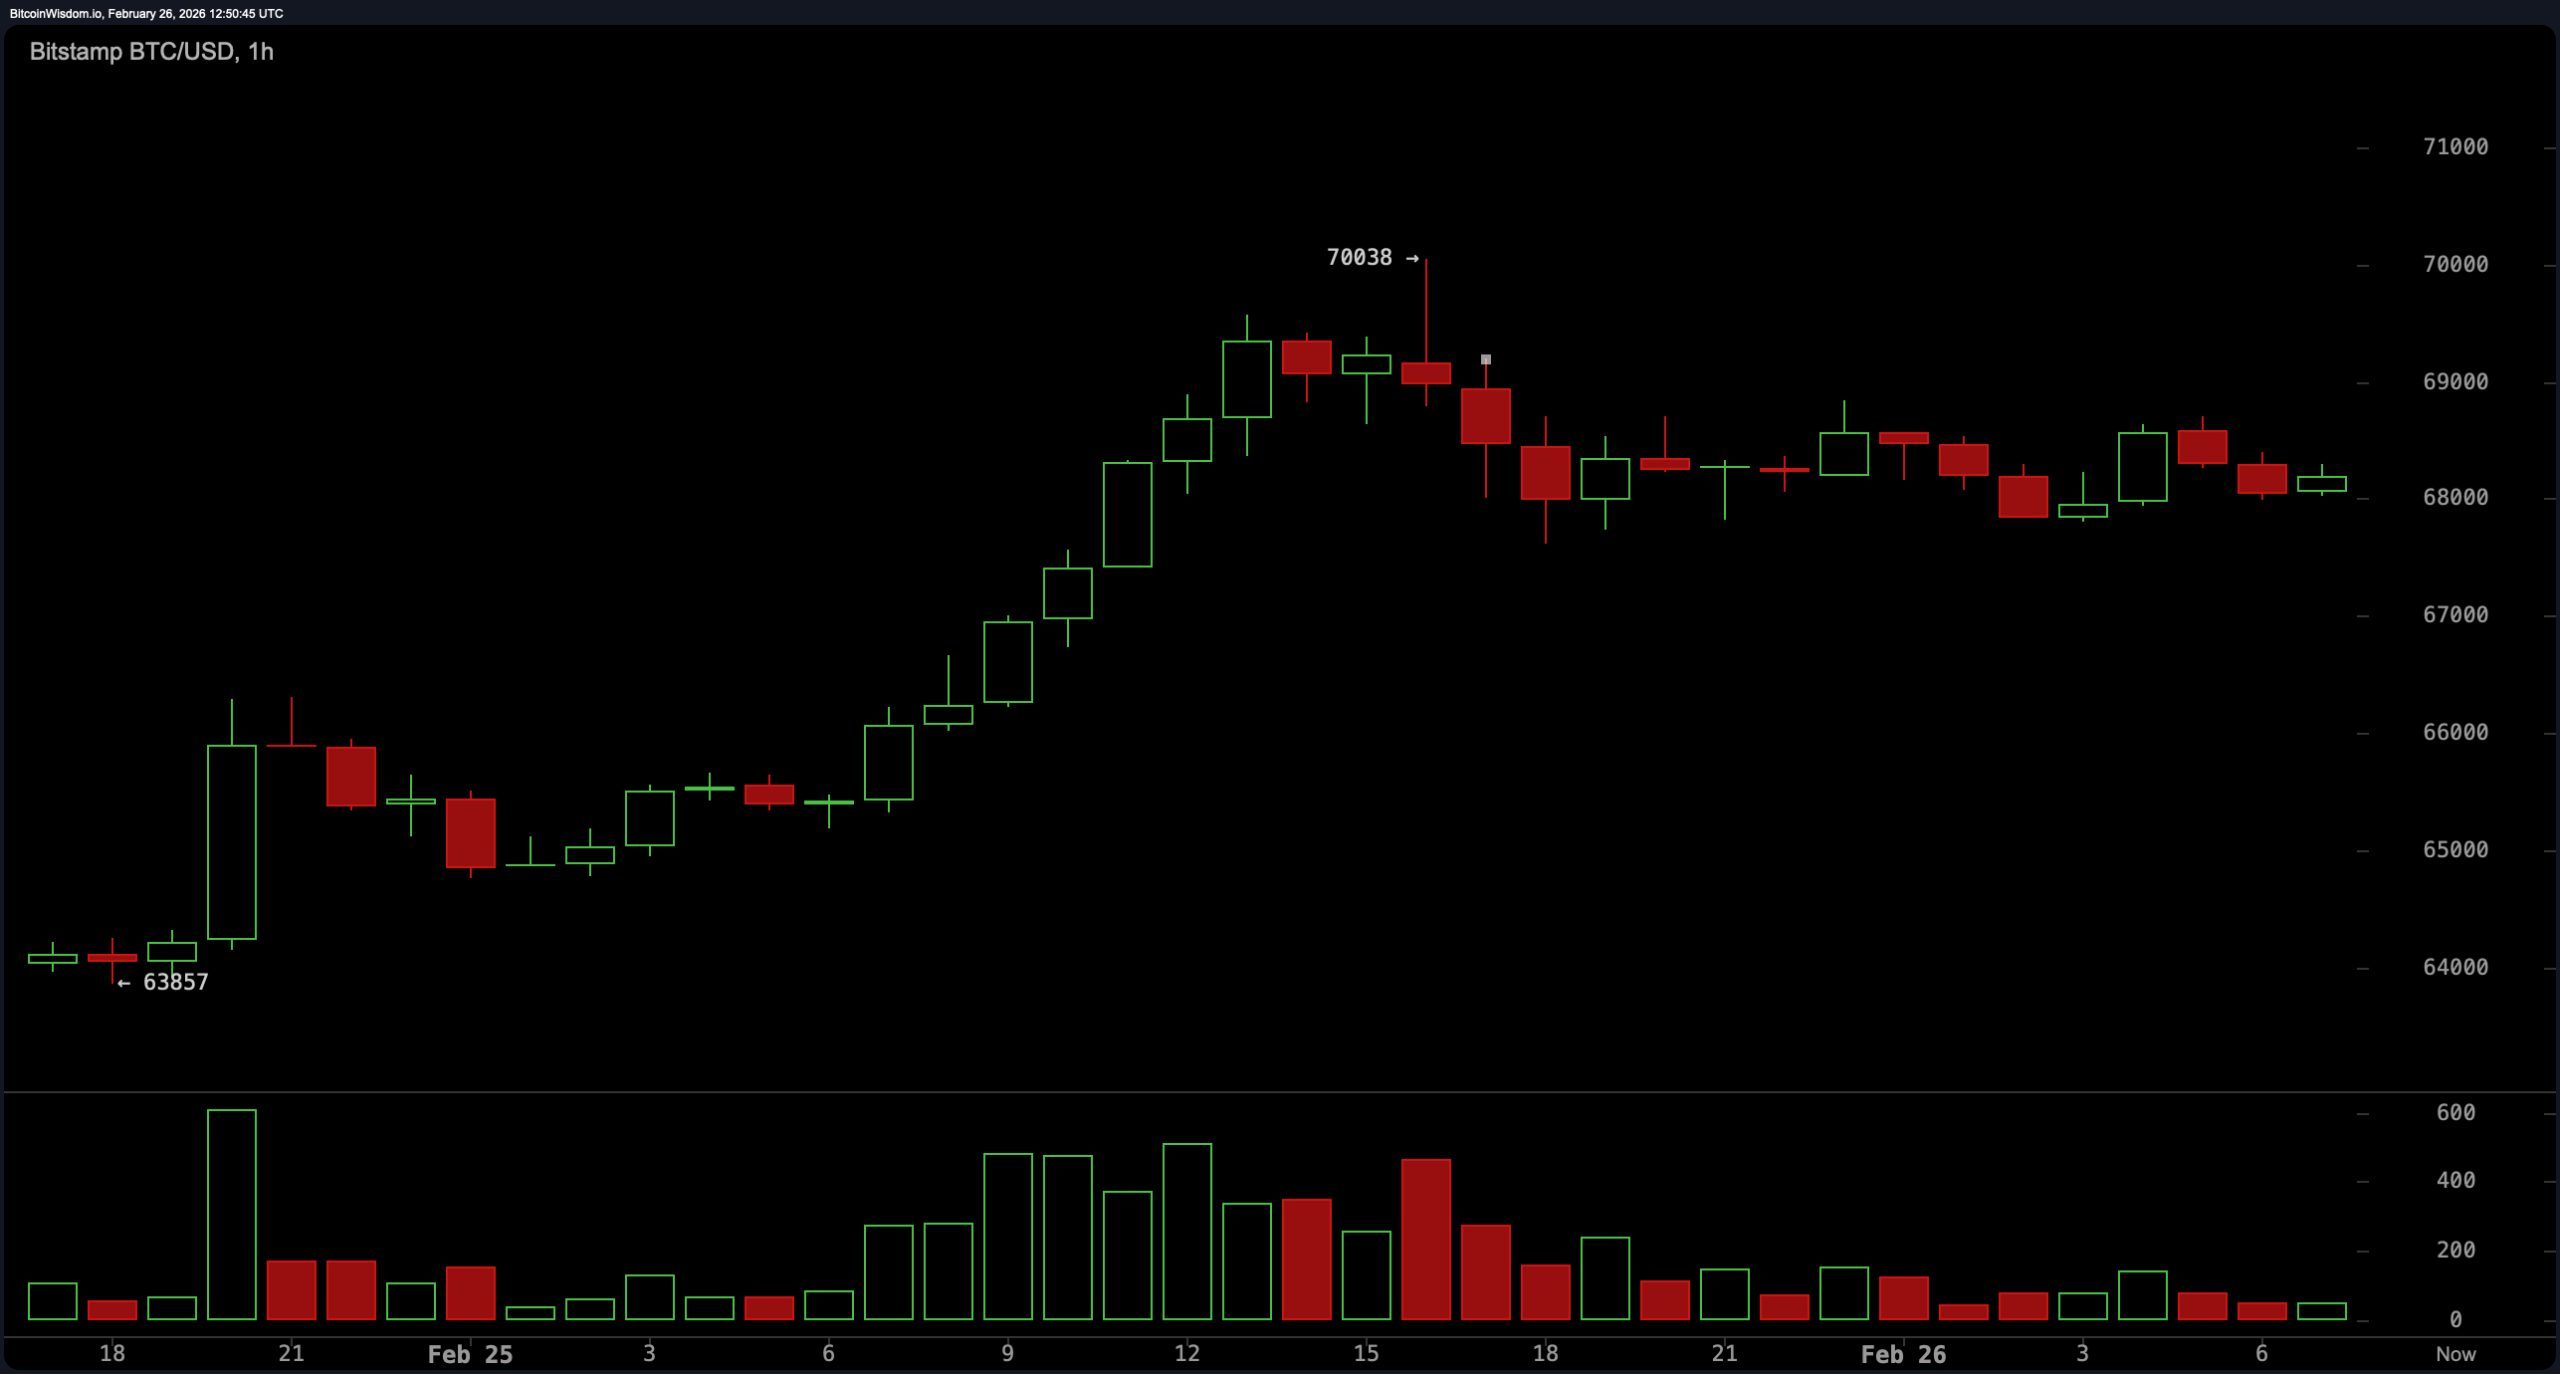
$BTC/USD 1-hour chart via Bitstamp on February 26, 2026.
The oscillators are balanced but provide an interesting mix. The Relative Strength Index (RSI) reads 43, Stochastics reads 50, and Commodity Channel Index (CCI) reads 22, all neutral values. An average directional index (ADX) of 54 reflects meaningful trend strength, even if the direction is still in dispute. Awesome Oscillator is at -6,666, Momentum is at -622, and Moving Average Convergence Divergence (MACD) level is at -3,196, so the signal is tilted towards the positive despite being in negative territory. In other words, the underlying momentum is about to turn before the price fully commits.
Moving averages reveal a divided technical battleground. The Exponential Moving Average (EMA) (10) of $67,301 and the Simple Moving Average (SMA) (10) of $66,936 are favorably aligned below the current price. The EMA (20) of $69,240 contrasts with the SMA (20) of $67,865, while the EMA (30) of $71,761 and SMA (30) of $71,044 remain overhead.
Long-term pressure continues with the EMA (50) at $76,123, SMA (50) at $79,194, EMA (100) at $83,720, SMA (100) at $84,199, EMA (200) at $91,296, and SMA (200) at $97,903. The short-term average is trending up, but the stack on higher time frames remains elevated. So getting $70,000 to $72,000 back isn’t just psychological, it’s structural.
Overall, Bitcoin is compressing below a major resistance cluster around $70,000. If this ceiling turns into support, the path to $75,000 and beyond will be technically consistent. If you are denied again, the $65,000 area may come back into focus before your next attempt. This market isn’t disrupted; it’s spiraling. And when compression is resolved, it is rarely resolved gracefully.
Bullish verdict:
If Bitcoin confirms the higher timeframe close and converts the $70,000-$72,000 resistance band into support, the technical structure will decisively shift in favor of continuation towards the $78,000-$80,000 area, the short-term moving averages will curl upwards, and the momentum indicators will try to convert from negative territory.
Bear verdict:
If price fails again at $70,000 and loses the $67,000-$65,000 support pocket, the compression will resolve lower, opening the door to a deeper rotation towards $63,000 and potentially retesting the $60,000 macro support as the higher time frame moving average continues to weigh on overhead.
Frequently asked questions 🔎
- What is the price of Bitcoin on February 26, 2026?
Bitcoin is trading at $68,269, stabilizing just below the $70,000 resistance level. - What are the current major resistance levels for Bitcoin?
The major resistance zone is between $70,000 and $72,000 on the daily time frame. - What are the major support levels for Bitcoin?
The main support levels are intraday $67,000-$68,000, stronger support at $65,000, and macro support at $60,000. - What do the indicators suggest about Bitcoin’s momentum?
The Relative Strength Index (RSI), Stochastics and Commodity Channel Index (CCI) are neutral, while momentum and Moving Average Convergence Divergence (MACD) are showing early signs of upward pressure.