Ethereum Price Analysis Today: Read the Latest Macro-Driven Views $ETH Momentum, key levels and trader risk across time frames.
Traders face a delicate setup today as Ethereum price continues to rise across multiple time frames within a fragile long-term structure.
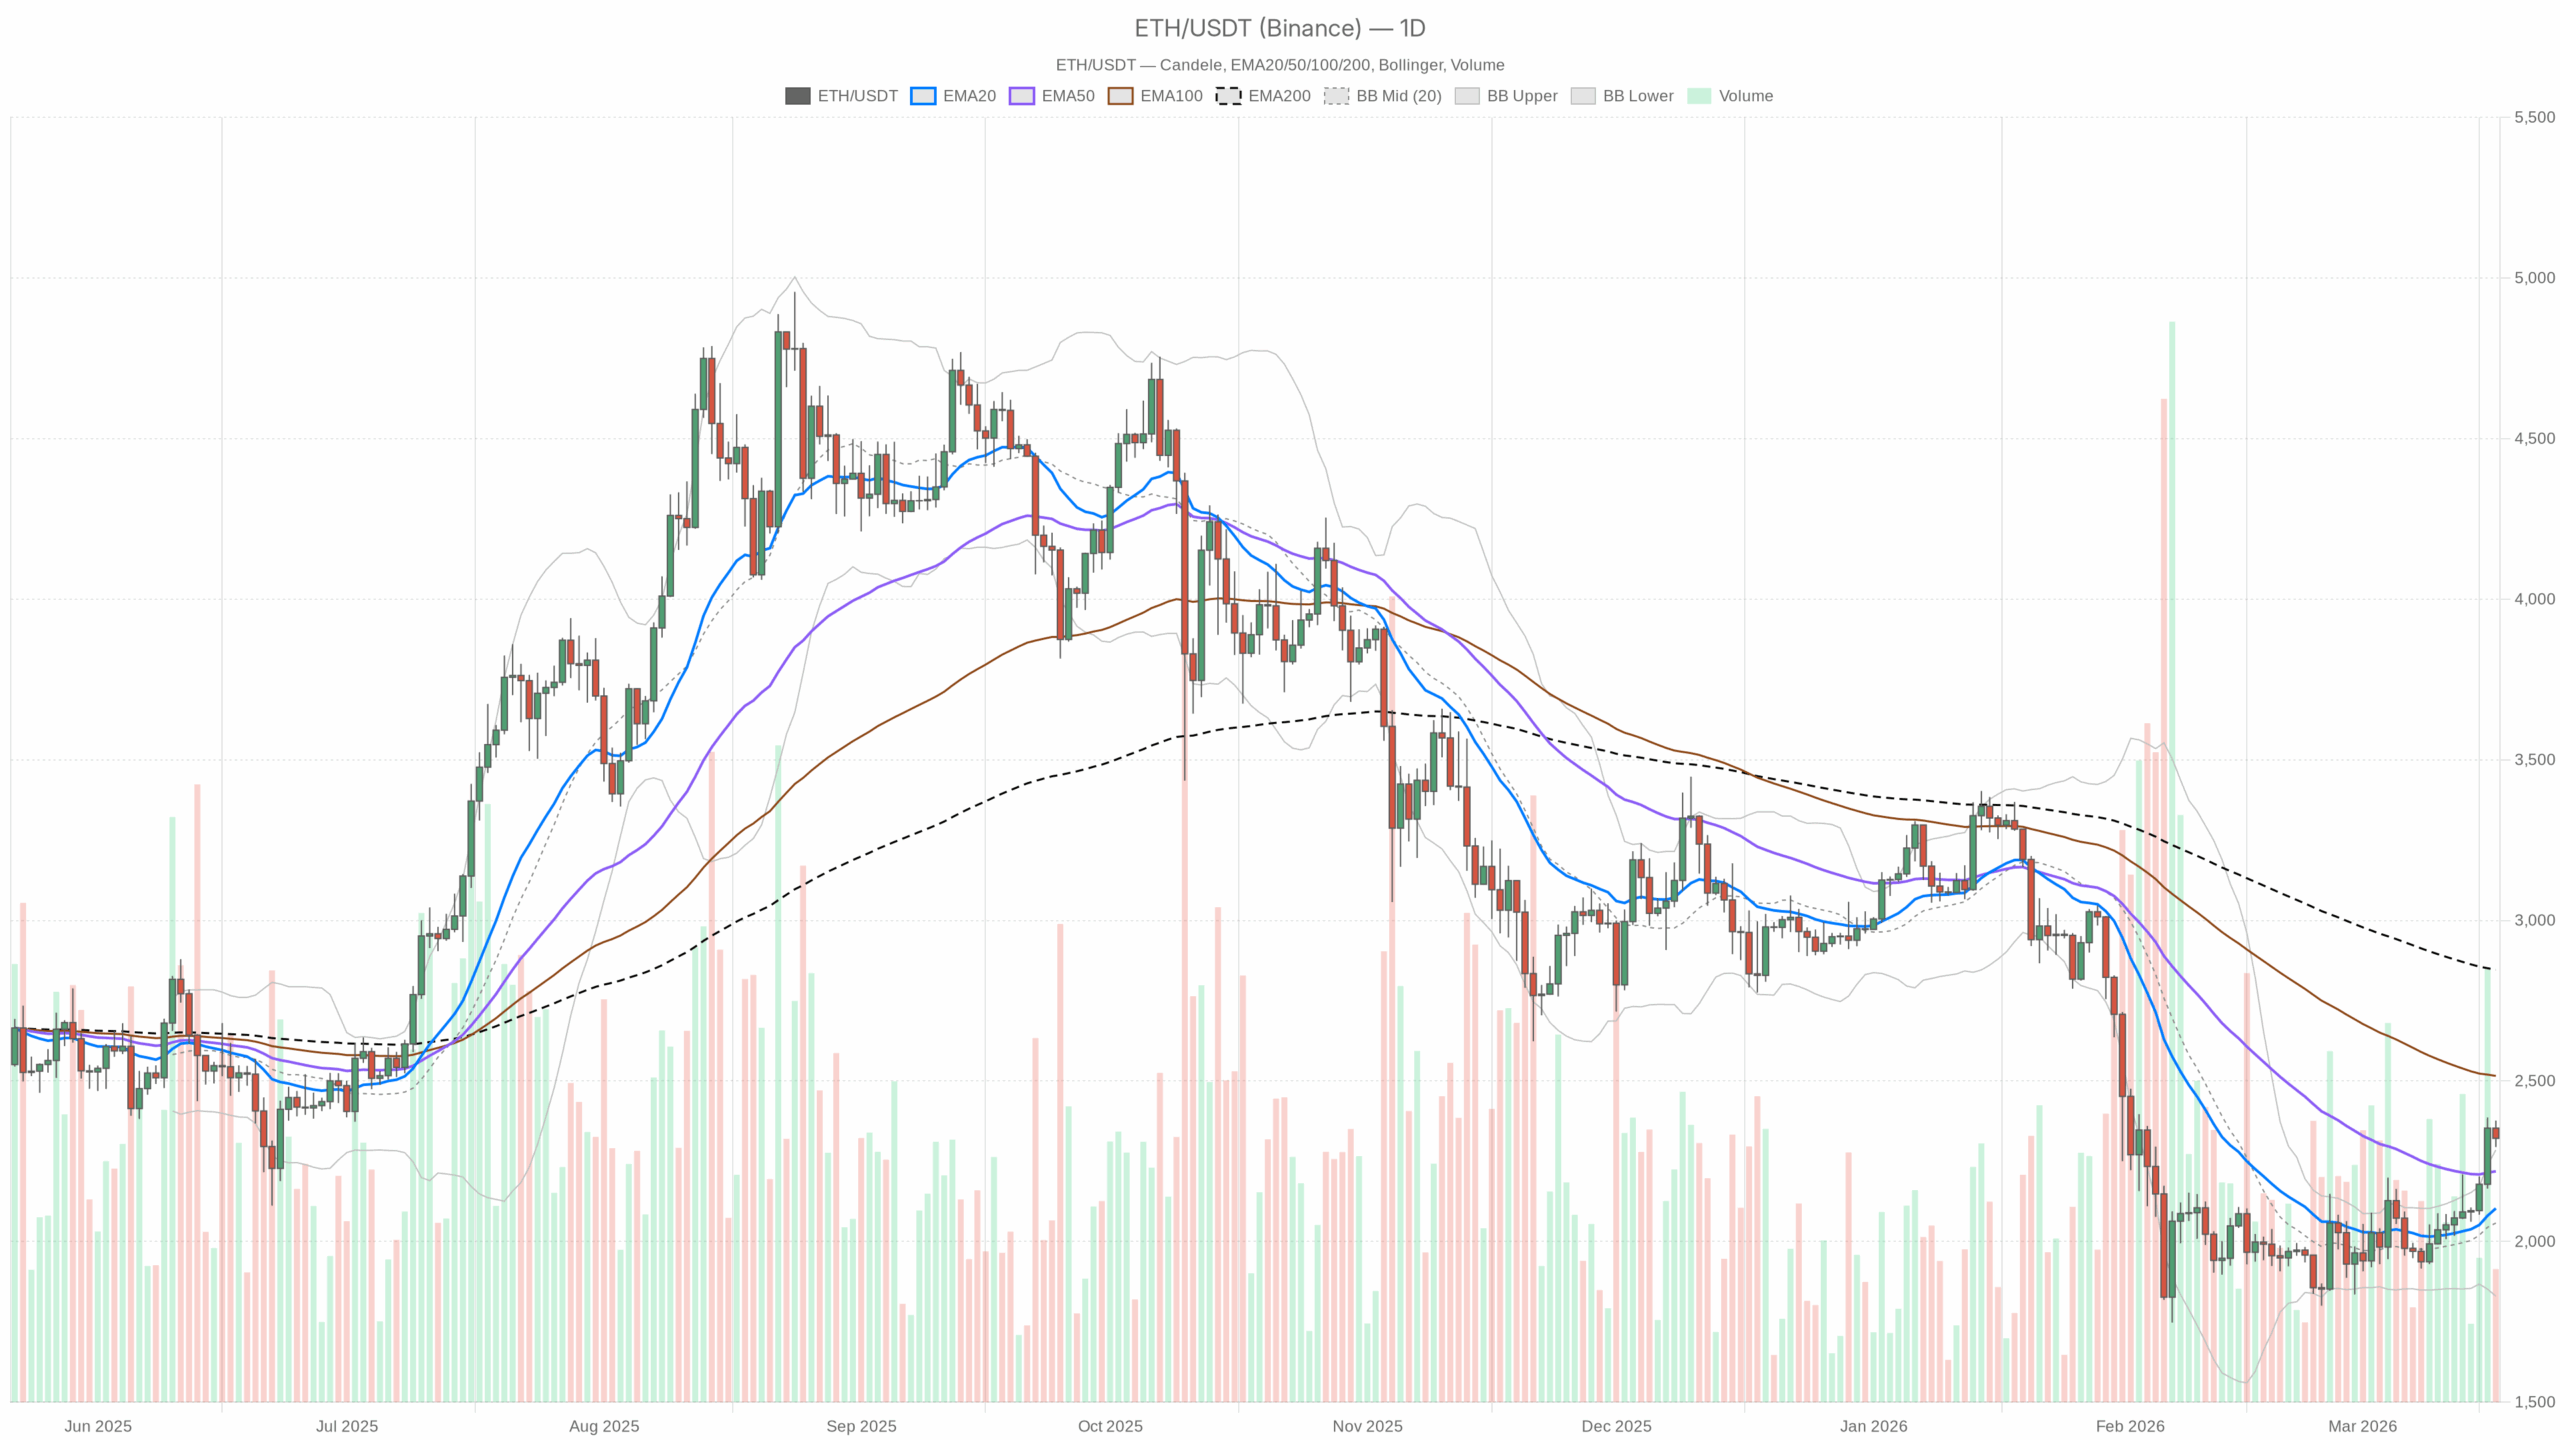 $ETH/$USDT Daily chart including EMA20, EMA50, and volume
Loading=”lazy” />
$ETH/$USDT — Daily chart including candlesticks, EMA20/EMA50, and volume.
Daily Trend: Short-term bullishness amidst a damaged long-term structure
The dominant scenario on the daily time frame is: Tactically strong but structurally weak.
$ETH closes on $2,321.27 At the following daily levels:
- EMA 20: $2,103.18
- EMA 50: $2,218.66
- EMA200: $2,845.71
The price is Above 20-day and 50-day EMAHowever, it is still well below the 200-day EMA.
How to read this: Short- and medium-term participants clearly have control. the buyer was dragged $ETH Return above the fast trend line and intermediate trend line. However, roughly speaking, More than $500 and less 200 days means the long-term trend is still down and repairing. this is a classic Reversal of a countertrend within a broader bearish or correction regime.
Daily RSI (momentum)
Momentum is firmly positive and leaning toward bullish territory, but not overbought yet.
What it means: Buyers have the upper hand and there is still room to push prices higher before the market becomes technically tense. This is typical of a rally leg where you have fuel left, but not a rally leg where everyone already has maximum long energy.
Daily MACD (trend strength)
- MACD line: 33.48
- Signal line: -15.81
- histogram: 49.29 (strong plus)
The MACD line is well above the signal and shows a large positive histogram. strong upward momentum Behind the recent movements.
What it means: This is not a weak bounce. That’s a pretty strong impulse from the bass. When the histogram bars are rising like this, an upswing sequence is usually in full swing. However, this also means that prices can move quickly and fall quickly once the impulse cools.
Daily Bollinger Bands (Volatility and Positioning)
- Middle band: $2,057.66
- Upper band: $2,285.17
- Lower band: $1,830.16
- price: $2,321.27 (currently trading just above the upper band)
$ETH teeth Break through the top of the Bollinger Band On the daily chart.
What it means: Prices are on the brink of increased volatility. In a healthy uptrend, strong stocks can wander within the band for days on end. That being said, statistically this is also where mean reversion traders start looking for counter movements. This indicates a strong bullish move that could be ahead in the very short term.
Daily ATR (Range and Risk)
Daily volatility is increasing, but not extreme $ETH At this price level.
What it means: A typical daily fluctuation is about $110 anyway. For traders, it means that intraday entries and stops should be taken into account in approximate proportions. 5% daily noise band In either direction. Position sizing that ignores this may result in normal volatility.
Daily pivot level (short term map)
- Pivot point (PP): $2,330.69
- Resistance 1 (R1): $2,367.24
- Support 1 (S1): $2,284.73
$ETH just trading Under daily pivot and near the upper band region.
What it means: The $2,330 to $2,335 zone is today’s immediate battleground. A breakout above that pivot would confirm that buyers maintain short-term control. However, a sustained rejection below that will revert the intraday bias to a sideways-to-downward trend, even within a broad intraday rally.
Hourly chart: Intraday trend confirms bullish daily bias
The time frame of 1 hour is bullish Momentum has slowed slightly, but is roughly in line with the daily upside bias.
- Price (end of first half): $2,322.39
- EMA 20: $2,313.78
- EMA 50: $2,255.85
- EMA200: $2,139.21
Price is above all major EMAs on the hourly chart, with the short EMA bullishly stacking on top of the long EMA.
What it means: Intraday trend following is long and profitable. 20-EMA (approx. $2,314) may attract buyers in the first place. 50-EMA (approx. $2,256) Test how strong this intraday trend really is.
hourly RSI
Momentum on the hourly chart is positive, but it is not growing.
What it means: The bulls are in control in this time frame, but the momentum is more controlled than euphoric. There is room both for further gains and for a pause or sideways consolidation without immediately breaking the overall trend.
Hourly MACD
- MACD line: 21.62
- Signal line: 30.46
- histogram: -8.84
The MACD histogram became slightly negative as the MACD line fell below the signal line.
What it means: Short-term upward momentum is cooling. This does not invalidate the uptrend, but it does suggest a potential pause, a shallow pullback, or an intraday tape range rather than a straight extension further up from here.
hourly bollinger bands
- Middle band: $2,326.91
- Upper band: $2,376.16
- Lower band: $2,277.66
- price: $2,322.39 (near middle band)
Price has averaged back to near the middle band after previously spending time near the upper band.
What it means: Movement during the day is becoming normalized. The market is digesting previous gains rather than creating new momentum right now. This is typical before a continued breakout or deeper shakeout.
Hourly ATR and Pivot
- ATR 14 (H1): $26.98
- Pivot point (PP): $2,321.40
- R1: $2,323.61
- S1: $2,320.17
Hourly volatility is modest, with an expected range of approximately $27 per hour.
What it means: The market is liquid and moving, but there is no panic. As the current price approaches the hourly pivot band, the market is deciding in real time whether to treat this area as a stepping stone (above R1) or a ceiling (below S1). Very short-term traders lock in around this micro range.
15 minute chart: neutral, execution is more important than direction
The 15 minute chart is neutral It is mainly useful for timing, not bias definition.
- Price (M15 Close): $2,322.24
- EMA 20: $2,324.81
- EMA 50: $2,325.36
- EMA200: $2,253.05
The price is wedged right between the 20 and 50 EMAs, essentially flat, but still well above the 200 EMAs.
What it means: Very short-term traders mini range. The near-term rise has stalled, but no intraday breakout has been confirmed. Above the 200-EMA, the path of least resistance holds, but entry and exit require precision.
15 minute RSI and MACD
- RSI 14 (M15): 47.77
- MACD line: -2.07
- Signal line: -3.51
- histogram: 1.44 (slightly positive)
The RSI is mid-range and the MACD histogram has just turned slightly positive.
What it means: Short-term pressures have eased. The market is catching its breath. There is a slight bullish trend during the day, but nothing strong enough to overturn the larger hourly or daily situation. This is a typical chop where liquidity providers have to be aggressive and directional traders have to be patient.
15 minute Bollinger Bands, ATR, Pivot
- Middle band: $2,318.63
- Upper band: $2,336.60
- Lower band: $2,300.66
- ATR 14 (M15): $11.89
- Pivot point (PP): $2,321.35
- R1: $2,323.51
- S1: $2,320.07
The price is hovering around the 15-minute pivot, the band is relatively tight, and the expected range is modest at around $12 per bar.
What it means: Fine structure is well balanced. A push through the upper band and $2,336 area or the lower band and $2,301 area will likely result in a short burst of volatility and set the next intraday bar.
Macro context: Capital is prudent; $ETH Still in beta play
meanwhile $ETH Although the economy is on a recovery trend, the overall market backdrop remains cautious. the current 2024the setup remains similar throughout the major cycles.
- Total market capitalization: Approximately $2.62 trillion, an increase of approx. 1.7% within 24 hours
- Advantages of Bitcoin: About 56.7%
- $ETH Market capitalization share: around it 10.7%
- Fear and greed: 28 (fear)
What it means: We are at a stage where the market is: Selective risk-on. Bitcoin remains the primary risk barometer, with Ethereum trading as a high beta on the move. However, the emotional profile (fear) indicates that large players are not yet in full-scale chase mode. gather at $ETH It can be extended, but it can also be quickly reversed if: $BTC Lose your footing.
On-chain and DeFi activity continues to be constructive, leading to high fees uniswap and curvebut short-term pricing is still more about macro risk conditions, ETFs, or liquidity narratives than marginal DeFi metrics.
Main scenarios for Ethereum price today
Based on daily time framethe main scenario is Tactically strong Although there is a trend towards higher continuity, it is still in a fragile long-term structure.
Bullish scenario (main)
In the bullish case, $ETH We extend this impulse leg above the key short-term support.
Main conditions and levels:
- Daily prices stay above EMA 20 (approximately $2,103) and preferably more EMA 50 (approximately $2,219).
- RSI of daily balance 60~70 A band without sudden divergence or collapse.
- The MACD histogram remains positive on a daily basis, confirming the sustainability of the trend.
- During the day, the hourly chart is trading above the price. H1 EMA 50 (approximately $2,256).
Upward roadmap:
- First, collect and hold on top. Daily pivots range from $2,330 to $2,335.
- Next, test the intraday resistance zone. $2,360 – $2,370coincides with the upper region of the R1 and H1 Bollinger Bands on the daily chart.
- If the momentum continues, $2,450 to $2,500 This region is likely to become the next major liquidity pocket.
Here’s what invalidates today’s bullish scenario:
- nice break Back below $2,285 (Daily S1) Hold up until the closing price.
- The time frame structure has turned decisively bearish and the price is below. First half EMA 50 And the RSI has slipped into persistent sub-45 territory.
- The daily MACD histogram is rolling hard towards zero, indicating a loss of momentum.
Bearish scenario (countertrend today but consistent with long-term damage)
The bearish case is based on the following idea: $ETH is overextended for a long-term downtrend and has extended beyond the daily Bollinger upper band, setting up a mean-reversion move.
Main conditions and triggers:
- If it was not possible to hold the $2,330 We pivoted and the denials were repeated during the day.
- Take a break below $2,285 (Daily S1) Turn that area into resistance.
- The hourly MACD remains negative and the RSI is trending towards the 40 zone from the current mid-50s.
Downside roadmap:
- first pullback $2,250 – $2,260 This is the H1 EMA 50 area and mid-range support.
- When sellers apply more pressure, $2,180 to $2,200 The band is more likely, but this is almost at the top, but close to it. Daily EMA 50.
- Deeper flashes may eventually explore nearby $2,100 zone (daily EMA 20), which is an important line for bulls in this structure.
Here’s what invalidates today’s bearish scenario:
- A powerful extension of the above $2,370 The hourly closing price is above that level.
- Hourly RSI pushes up and maintains 65–70 Accompanied by a new positive MACD cross.
- The daily candlestick has broken firmly above the upper Bollinger Band and trading volume is increasing, suggesting a trend-following breakout rather than a simple overshoot.
How to think about positioning, risk and uncertainty
For traders paying close attention to today’s Ethereum price, this message is nuanced and calls for respecting both trends and volatility.
- bias: In the short term, the path of least resistance is to the upside, supported by daily bullish momentum (RSI and MACD) and supporting hourly trend structure (EMA).
- Structural risk: $ETH is still well below the 200-day EMA. This is a reminder that the market is rising within a larger unresolved corrective structure. The more a trader chases the top, the more they become dependent on this impulse to develop into a complete trend reversal.
- Volatility: If the daily ATR is close $114 and around ATR per hour. $27intraday swings can be sharp enough to test risk limits right away, especially for tight stops.
- Emotions: Fear-dominated sentiment means the market can overshoot in both directions, panic on pushbacks, and chase wildly when key resistance lines break. The size and duration of the position should reflect its volatility.
As a practical matter, short-term and medium-term traders are likely to treat a pullback to the downside. $2,260 – $2,280 This area serves as a stress test for the rally. If these levels hold with supportive momentum on an hourly basis, the bullish scenario will maintain the upper hand. If they lose the hard sell, $BTC is also weakening, indicating that the market has a long-term downtrend.
No matter which side a trader leans on, the important point today is that range of results. $ETH It could be a trend, but it could also be a sharp reversal from an overextended daily upper band. Edge comes from adjusting time frames, risk limits, and key levels rather than assuming a single, guaranteed direction.