
Ethereum price continues to fall as long-term holders sell off at the fastest pace since 2021, putting steady pressure on ETH market sentiment.
summary
- Ethereum price is falling amid increasing daily selling pressure from long-term holders
- CryptoQuant futures data shows that net taker volume remains negative, suggesting that buyers have not regained control.
- Technical indicators and moving averages are still on the downside, maintaining a bearish trend.
Ethereum is trading around $3,211, down 10% in the past 24 hours. The price has fallen 4% in the past week and 21% in the last month, and is about 35% below its August high of $4,946. Trading volume increased by 32.7% to $49.6 billion, with activity increasing as prices fell.
Derivatives trading increased, with trading volume increasing 27.6% to $139.7 billion, while open interest decreased approximately 7% to $37.8 billion. This combination often means that traders close positions during declines rather than building new leverage.
Long-term ETH holders intensify sales
According to a November 14th post on X by Glassnode, long-term holders of Ethereum (ETH) have increased their sales activity over the past three months. Based on 90-day trends, addresses that have held ETH for 3-10 years are moving or selling an average of over 45,000 ETH per day. This is the group’s highest level of spending since February 2021.
Since late August, as Ethereum retreats from its new peak, the average daily spend for 3- to 10-year holders has increased to over 45,000 ETH/day (90D-SMA).
This is the highest level of spending by seasoned investors since February 2021.
📉 https://t.co/EO1LpkLbmL pic.twitter.com/eMw5rKteTX
— Glassnode (@glassnode) November 14, 2025
You may also like: BitDigital reaches $590 million in holdings and strengthens exposure to Ethereum
When long-term holders sell at this rate, it usually happens when they decide to lock in profits or limit their exposure after a large rally. This could mean that ETH could take more time to stabilize before buyers feel confident to re-enter.
CryptoQuant analysts also note that Ethereum net taker volume (30-day moving average) remains negative. Selling pressure in the futures market has eased compared to September, but sellers are still stronger than buyers.
In past market cycles, ETH has tended to find its bottom only after this indicator turns positive. Until that happens, the market is likely to level out further or decline before forming a clear foundation.
Ethereum price technical analysis
Ethereum is trading near the lower Bollinger Bands on the daily chart, indicating that the market remains under pressure. All major moving averages from the 10th to the 200th are below the price, maintaining the downtrend.
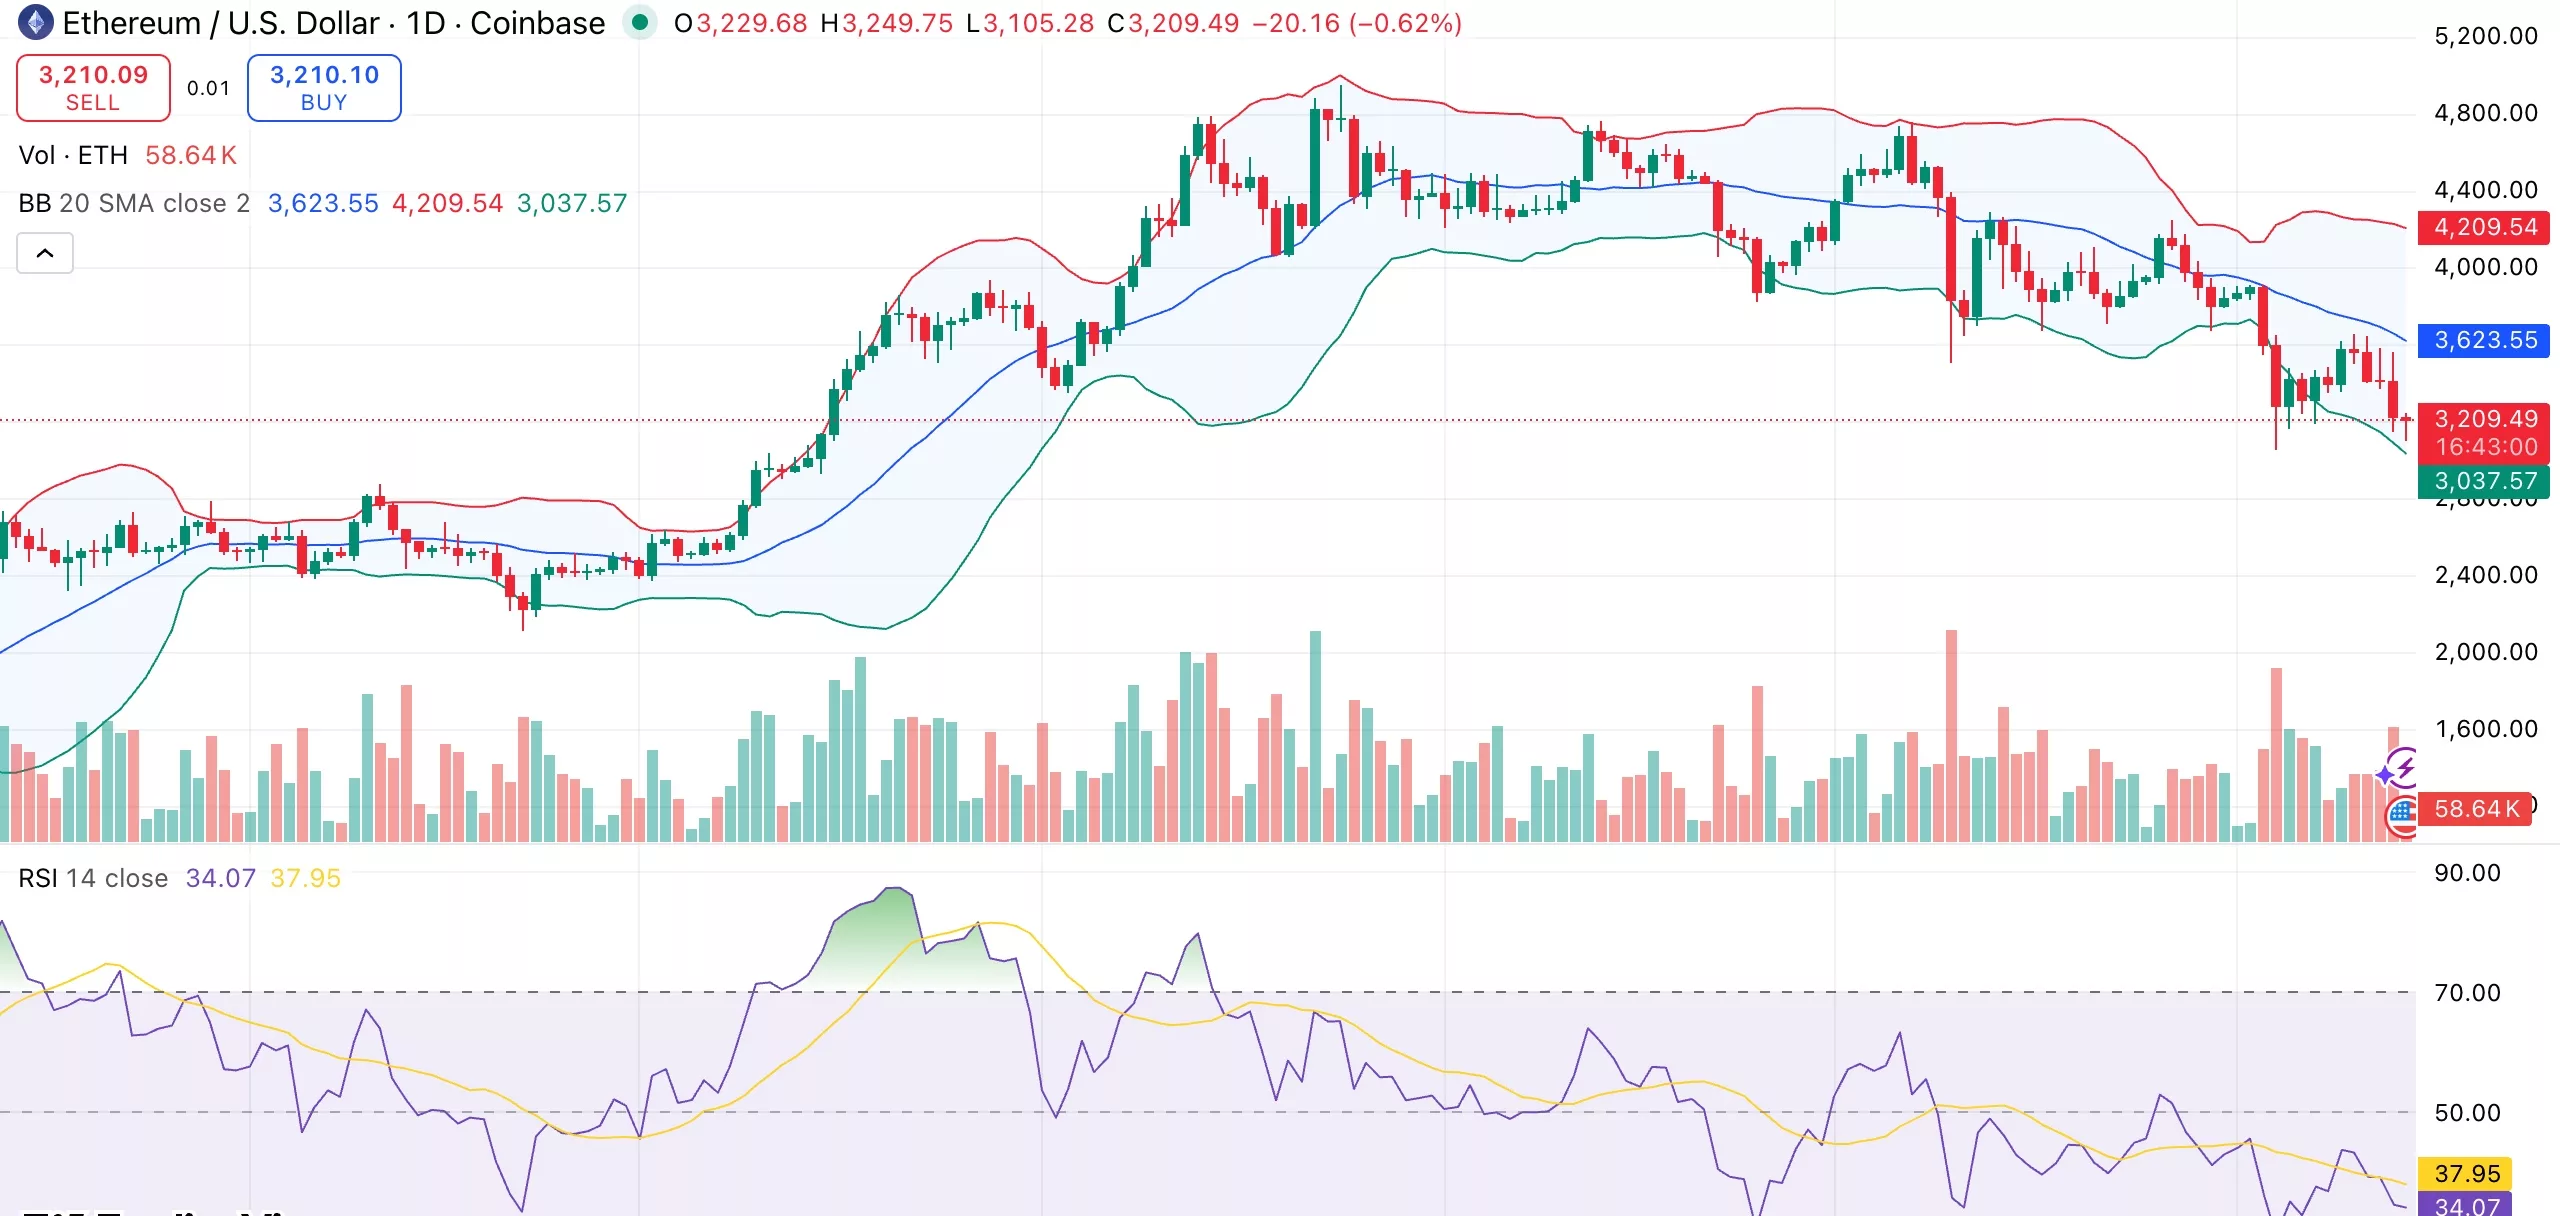
Ethereum daily chart. Credit: crypto.news
The Relative Strength Index is at 34, which is not yet in the heavily oversold territory, but momentum is weak. The MACD, like other short-term indicators, is also negative.
For ETH to gain traction, it will need to regain the $3,350-$3,400 range that has been acting as resistance. The next level to watch is $2,850, and if $3,000 cannot be maintained, $2,700.
read more: Why is the virtual currency market falling? (November 14th)