Cryptocurrency markets got off to another bad start this week as Bitcoin fell below the $91,000 level.
The leading cryptocurrency has fallen 1.6% in the past 24 hours and is currently trading at $90,940. The bearish performance comes amid continued geopolitical tensions between the US and Europe.
BTC If the decline continues, it could retest key support levels in the near term.
BTC Decrease in volatility to $90,000
Copy link to section
Bitcoin, the number one cryptocurrency by market capitalization, has failed to maintain its price above $91,000 and is currently trading around $90,900.
This performance follows a sharp selloff on Monday that saw $878 million worth of leveraged positions wiped from the market.
Analysts note that despite Bitcoin’s recent rally above $90,000, its technical structure remains weak.
Dr. Sean Dawson, head of research at on-chain options platform Derive.xyz, noted in an email to Invezz that Bitcoin volatility has steadily declined to around 38%, a two-month low and well below the 54% level seen in November.
ETH followed a similar path, with volatility shrinking from 78% to 53% over the same period, the analyst added.
“While markets appear calm on the surface, macro risks are rising. Escalating geopolitical tensions between the US and Europe, particularly around Greenland, raise the risk of a regime shift back to a more volatile environment, and that dynamic is not currently reflected in spot prices,” Dawson said.
Bitcoin has been trading in a range of $90,000 to $80,000 in recent months.
However, Dawson noted that Bitcoin could retest the $80,000 level by the middle of this year.
Data suggests that the market is in an increasingly depressed position in the first half of this year.
for BTC With expiration on June 26th, put open interest is heavily concentrated in the $75,000 to $85,000 exercise period, suggesting drawdowns in the mid-$70s to low-$80s are expected by the second half of this year.
While Dawson’s predictions may play out over the coming months, Bitcoin’s macro structure has remained unchanged in recent weeks.
This structure remains weak and indecisive, and leveraged traders suffer from this market indecision.
BTC Possible retest of $89,900 support level
Copy link to section
of BTCThe /USD 4-hour structure chart remains bullish despite losing 4% of its value over the past two days.
Although the structure remains bullish, market sentiment has turned bearish as traders record losses.
The MACD line has fallen into the negative zone, indicating that sellers are in control.
The RSI of 41 is below the neutral 50, suggesting an increasing bearish bias.
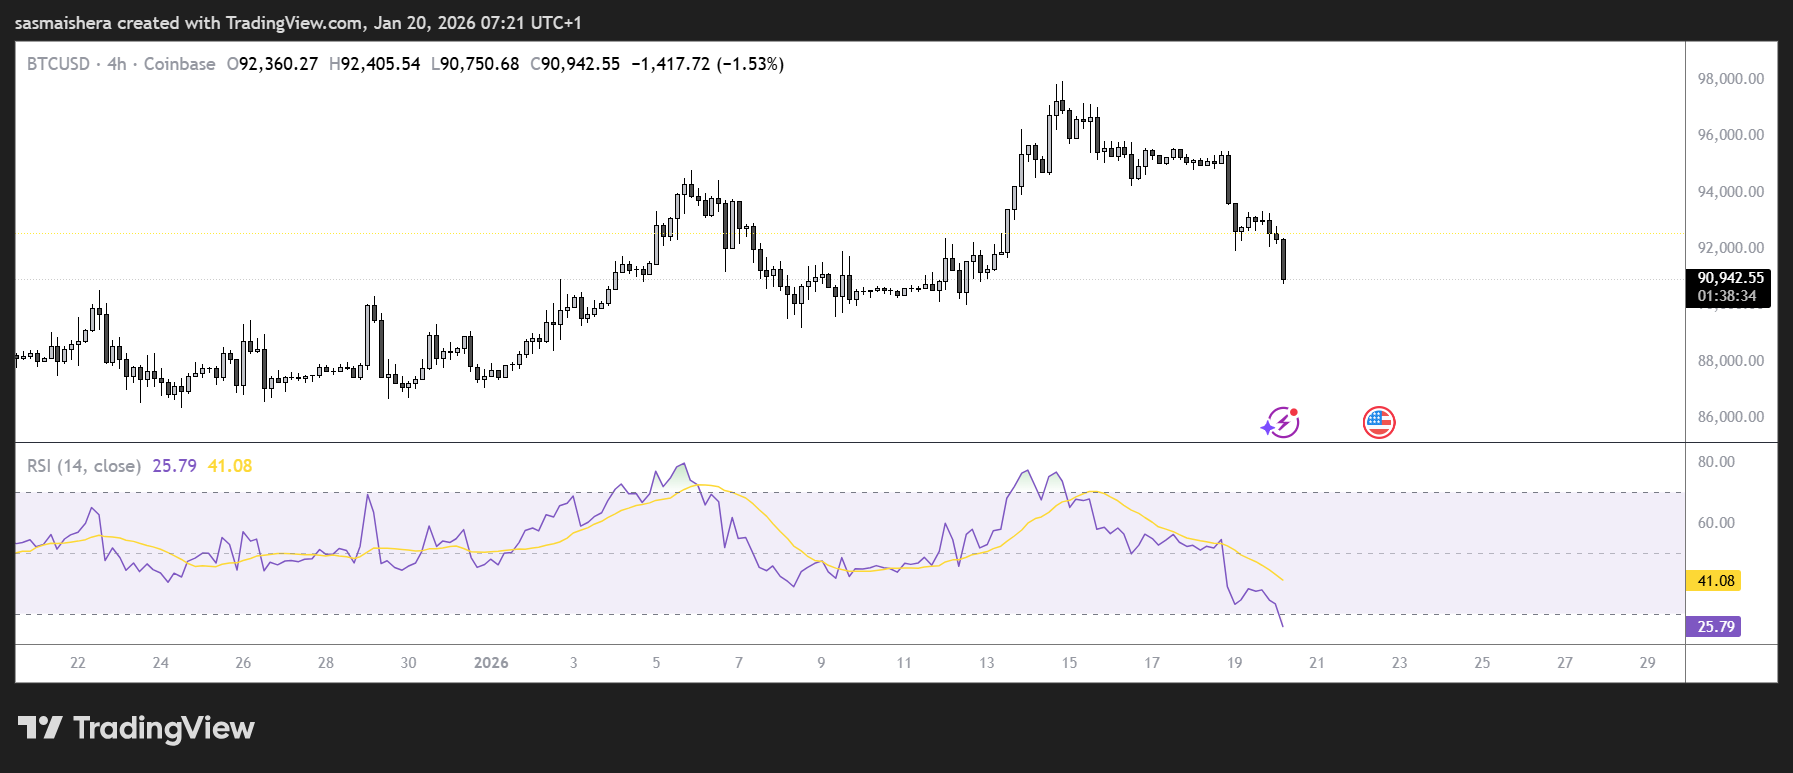
If the decline continues, BTC It is likely to retest the support and trading liquidity (TLQ) region at $90,285 in the coming hours.
When a bearish trend becomes prolonged, BTC It fell below $89,000 for the first time since January 2nd.
However, if support and TLQ levels are maintained; BTC A rebound is likely towards the 4-hour induced liquidity (ILQ) level of $93,319.