
Bitcoin holds key Fibonacci support as signs of recovery emerge and analysts eye a rally to all-time highs.
Renewed optimism over a potential interest rate cut by the Federal Reserve is sparking hope for a recovery in Bitcoin prices. Notably, Bitcoin’s price, currently at $87,729, reflects a period of consolidation over the past few hours following Monday’s peak of $89,209. The daily price range fluctuated between $86,215 and $88,097, indicating a relatively narrow trading range over the past 24 hours.
Looking at long-term performance, Bitcoin price has fallen by 3.5% in the past week and by 15.1% in the past 14 days. Performance indicators suggest a cautious outlook in the short term. Will Bitcoin test and break through key resistance levels for further gains?
Bitcoin price analysis
On the technical side, Bitcoin’s latest daily chart shows that Bitcoin is attempting to stabilize with a modest rebound from the local low of $80,559 on November 21st. The price is currently trading around $87,794, in the mid-zone of the current range and testing early signs of recovery.

Bitcoin
The Fibonacci retracement level indicates a clear resistance zone going forward. BTC remains below the 0.236 level at $89,013, while the 0.382 ($94,243), 0.5 ($98,470), and 0.618 ($102,697) levels represent key barriers that bulls must retake to confirm a broader trend reversal. Until then, the market is still in a correction structure, but the narrowing of the range suggests that momentum is shifting from aggressive selling to cautious accumulation.
In particular, a decisive break above the 0.236 Fib level could open the door for a recovery towards $94,000 and $98,000. Conversely, failure to sustain above the midrange could re-expose the $82,000-$80,500 support area.
The Awesome Oscillator (AO) reinforces this change by indicating a gradual decline in bearish momentum. After showing dark red bars throughout most of November, the indicator is now brightening and starting to show green bars. This is usually an early bullish signal.
Bitcoin repeats bearish setup in 2021
Other latest analysis for Merlijn The Trader highlights Bitcoin’s current market structure and the 2021 bear market setup are strikingly similar. In 2021, BTC failed to maintain important horizontal support levels and broke below the downtrend line, triggering a prolonged decline.
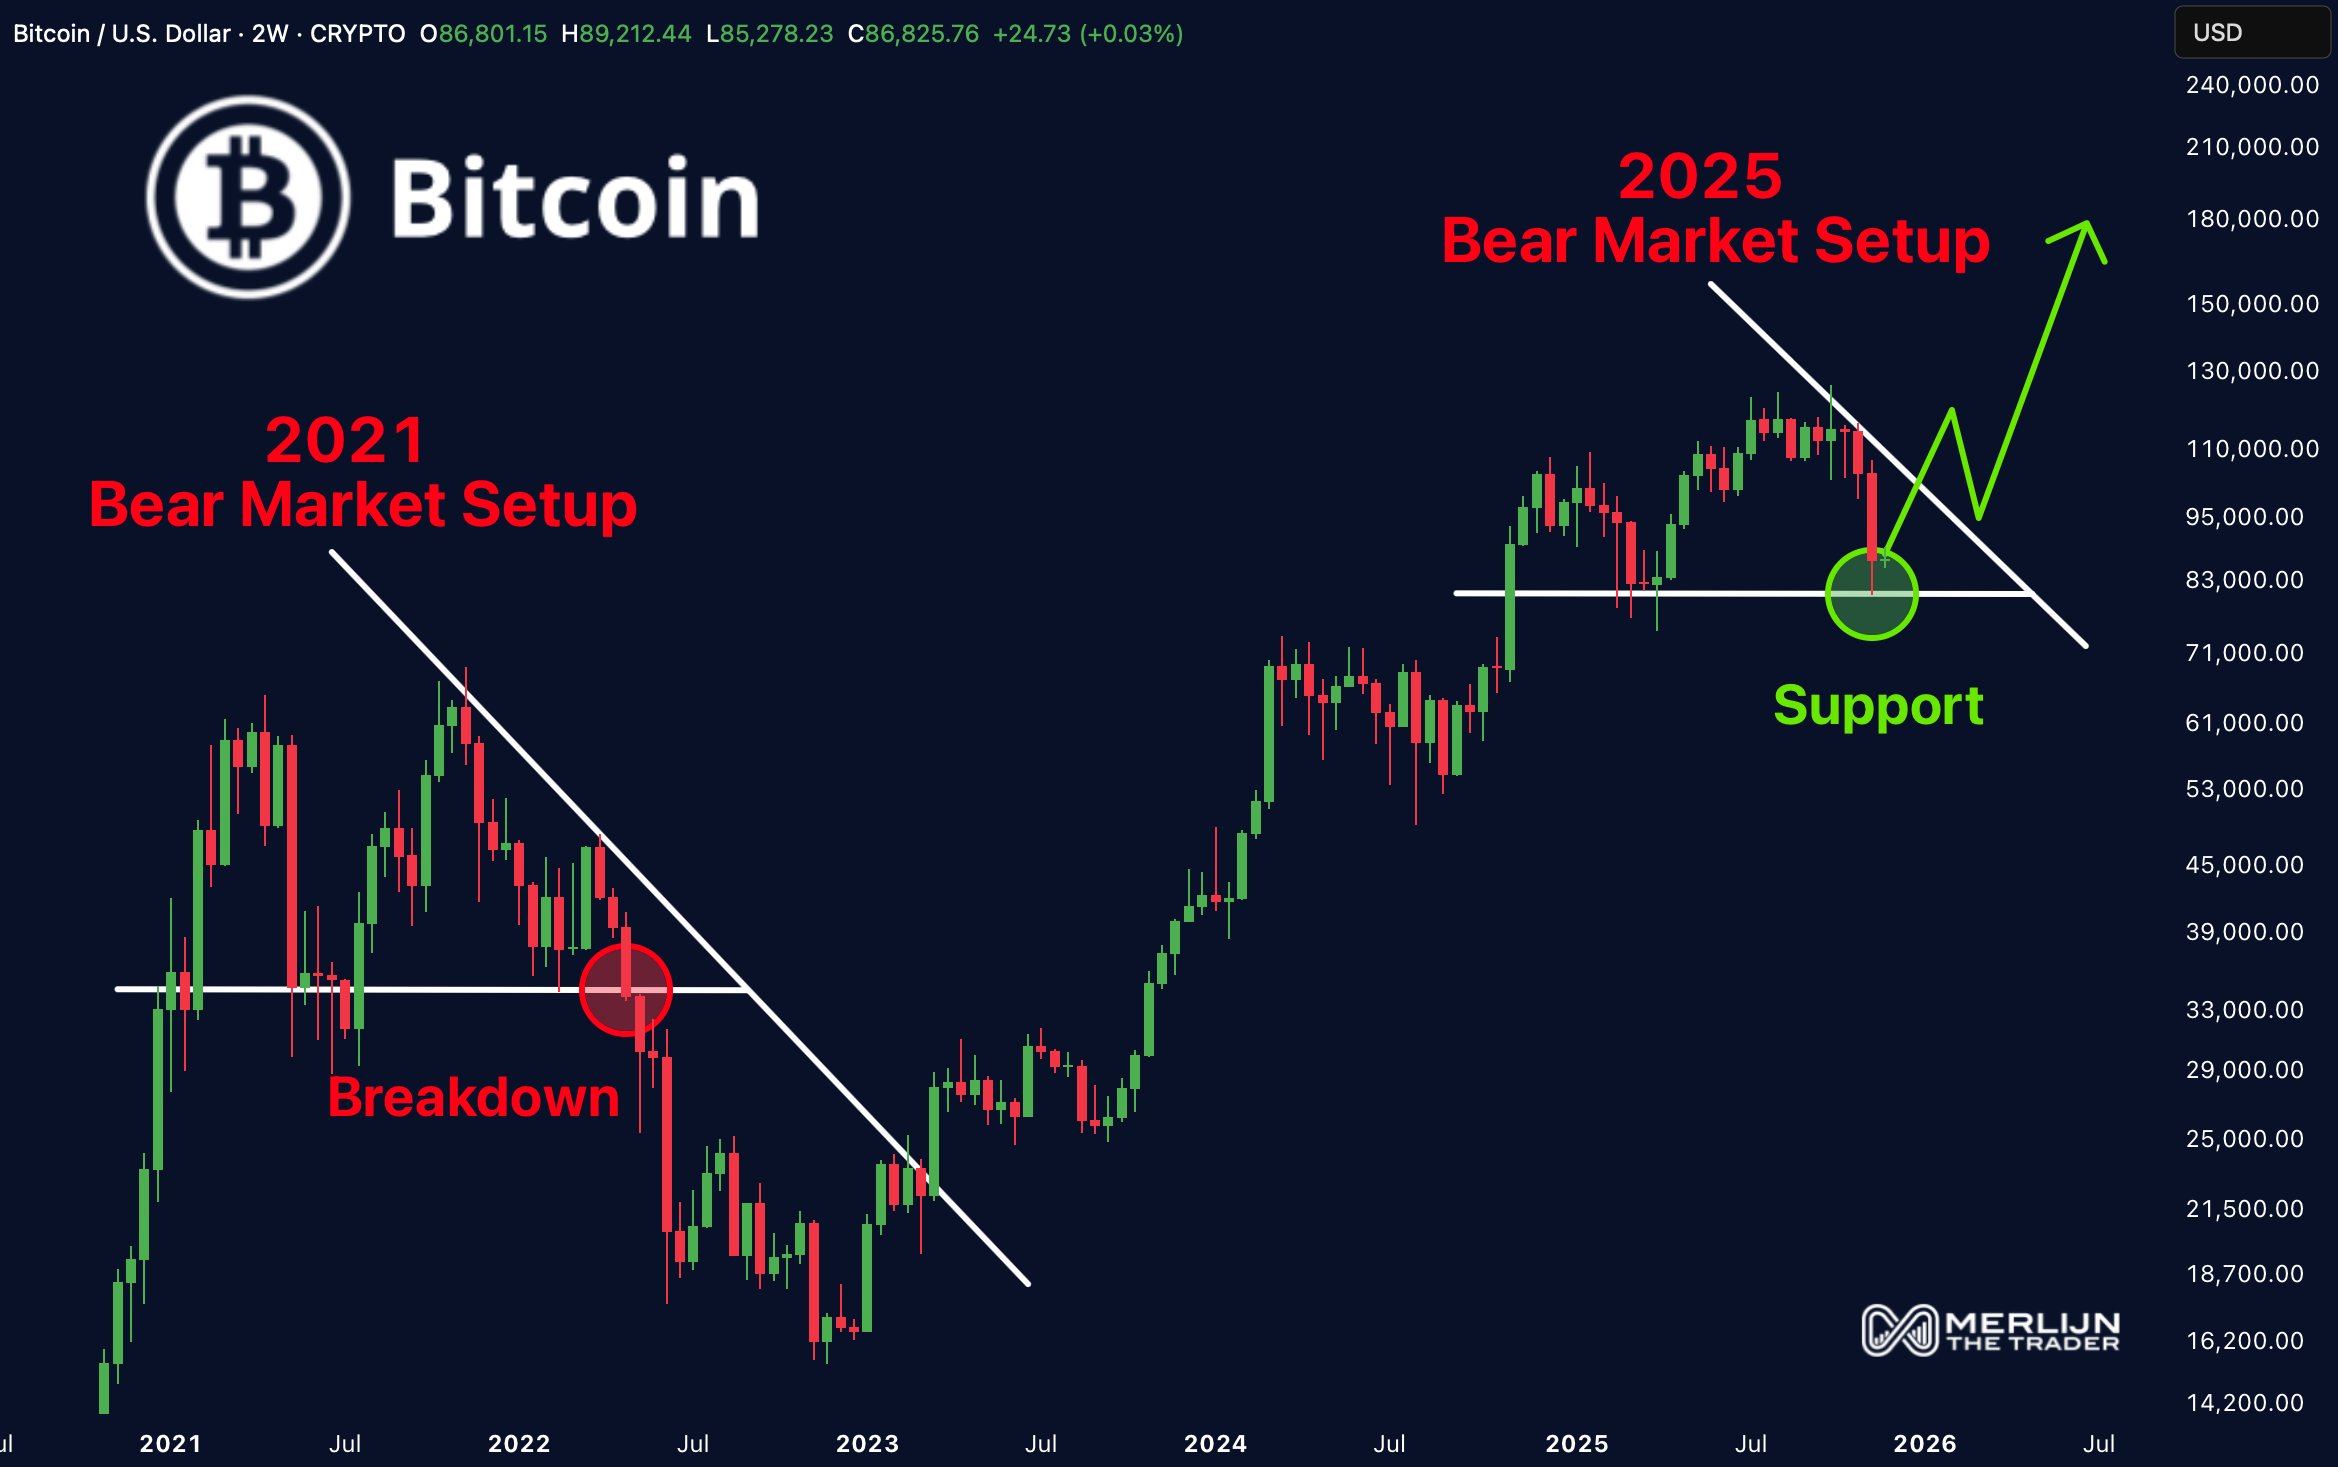
Today’s chart shows Bitcoin testing a similar structure, with price once again closing in on a major macro support zone, this time around $82,000. However, unlike in 2021, where this breakdown confirmed a deepening bear cycle, BTC rebounded from this level.
According to Marlin, the successful defense of this $82,000 base is a key differentiator that could lead to a bullish reversal for the overall market if the price manages to break above the general downtrend line. Analysts have set a target of $180,000 if Formation goes well. This is a 105% increase from the current price.