- Bitcoin price stalls its correction trend at $60,000 as sellers take a breather to regain bearish momentum.
- $BTC An MVRV ratio of 1.1% suggests the asset is approaching undervalued territory
- The Crypto Fear and Greed Index of 9% suggests strong bearish sentiment among market participants.
Cryptocurrency pioneer Bitcoin rose about 4% during U.S. market hours on Friday, reaching $68,814. The buying pressure followed a recent report that the consumer price index for January 2026 would grow at an annual rate of 2.4%, slightly below the expected 2.5%. This print shows that inflation is trending down, which strengthens the possibility that the Fed will cut rates further in 2026. Furthermore, on-chain data shows that Bitcoin price is gradually moving towards undervalued MVRV ratio territory, suggesting a possible rebound in the near future.
$BTC Approaching the historic MVRV reversal zone
Over the past four months, Bitcoin price has experienced a significant correction from its all-time high of $126,272 to $68,900, recording a 45% loss. This decline has pushed assets into areas that are seen as providing the fundamental basis of value.
The Market Value to Realized Value (MVRV) ratio is a widely tracked on-chain metric and stands at approximately 1.2 as of mid-February 2026. Measurements below 1.0 have traditionally highlighted periods when the average holder is experiencing unrealized losses, often times of cycle lows and recoveries. At its current level of approximately 1.1-1.2, the current indicator is approaching (but not yet entering) the historically significant undervalued band.
This cycle differs from previous cycles in that the initial rally failed to push MVRV to the extreme overbought levels of past bull markets, but instead reached more than triple the ratio with a violent euphoria. This lack of extreme conditions could influence how this recession plays out compared to previous bear phases.
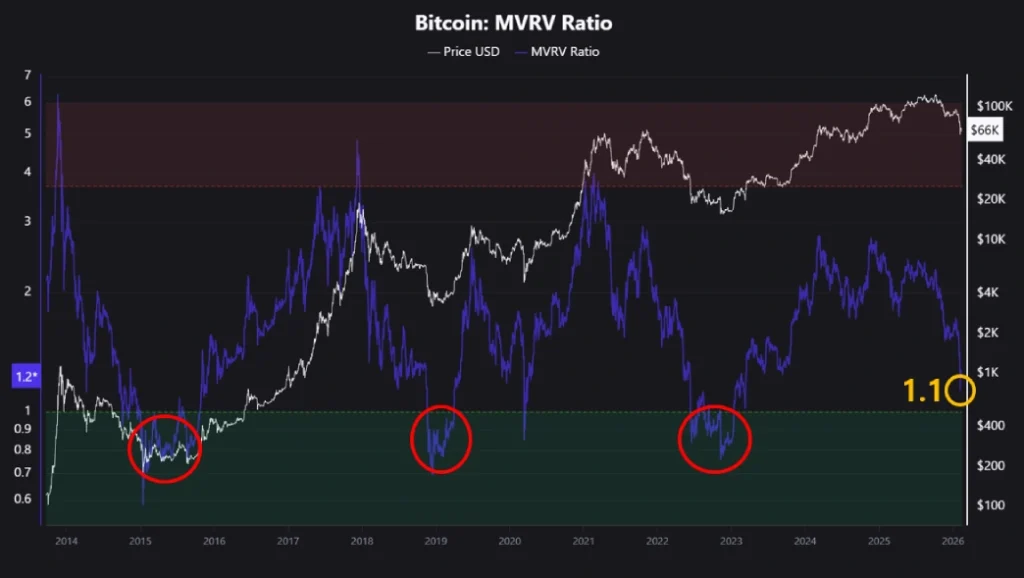
Historical chart patterns show MVRV falling to similar lows around 2015, 2019, and 2022, respectively, all of which preceded significant price reversals. The current configuration is a more subdued bull market structure, with a realized price floor around $55,000, which suggests further downside risk before testing the deeper support zone historically associated with undervaluation signals.
Bitcoin price swirls in a narrow range, heading for an imminent breakout
After a sharp correction to a low of $59,930 on February 6th, Bitcoin price has transitioned to a sideways trend on the daily chart. This consolidation, backed by low trading volumes and rejection on both sides of the range, indicates a lack of conviction on the part of buyers or sellers to drive sustainable movement.
However, as the general trend remains bearish, market sell-offs could take advantage of this sideways trend to regain bearish momentum. The momentum indicator RSI is back at 35%, indicating that prices are stabilizing after an excessive correction in the market.
With today’s 4% increase, Bitcoin price is currently trading at $68,828 and is gradually heading towards the overhead resistance between $73,175 and $74,500. A potential break through this barrier could strengthen buyers’ control over the asset and fuel a fresh rally towards $84,338.
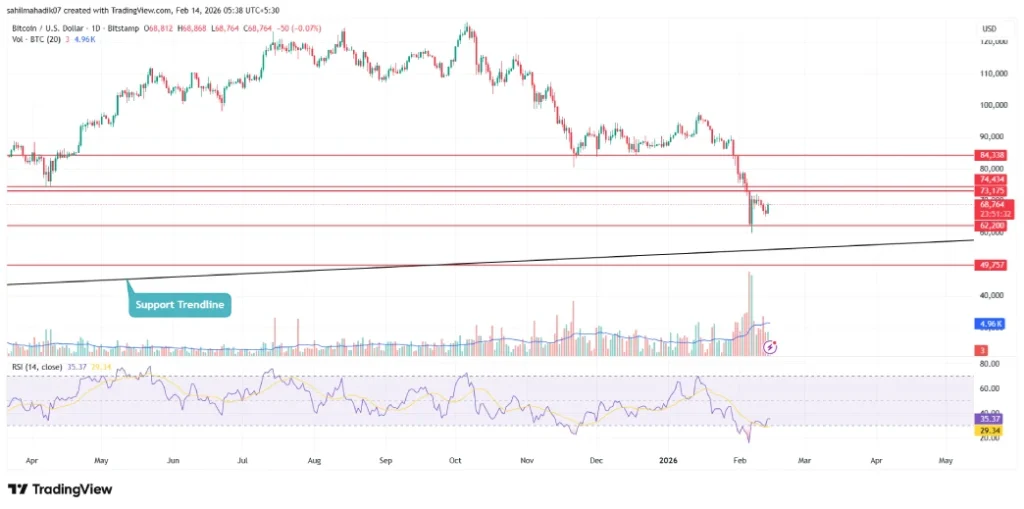
$BTC/USDT -1 day chart
Conversely, if sellers break through the $60,000 level, the next support lies at the $55,000 mark.