Bitcoin price began to rise steadily above $70,500 and $72,500. $BTC The price is currently consolidating and could aim for a new rally above $72,500.
- Bitcoin started a new rally after settling above the $70,000 zone.
- The price is trading above $70,000 and the 100 hourly simple moving average.
- On the hourly chart, a bullish trend line is forming with support at $69,000. $BTC/USD pair (data feed from Kraken).
- The pair could fall again if it trades below the $70,000 and $69,000 levels.
Bitcoin price begins to correct downwards
Bitcoin price extended its rise above the $68,500 zone. $BTC It picked up pace for a move above the $70,000 resistance zone. The price rebounded further above the $72,000 resistance level.
Finally, the bears emerged around $74,000. A high was formed at $74,062 and the price recently started a downward correction. There was a move below $72,000 and the 23.6% Fib retracement level of the move from the swing low of $66,164 to the high of $74,062.
Bitcoin is currently trading above $70,000 and its 100-hour simple moving average. Additionally, a bullish trend line has formed on the hourly chart with support at $69,000. $BTC/USD pair.
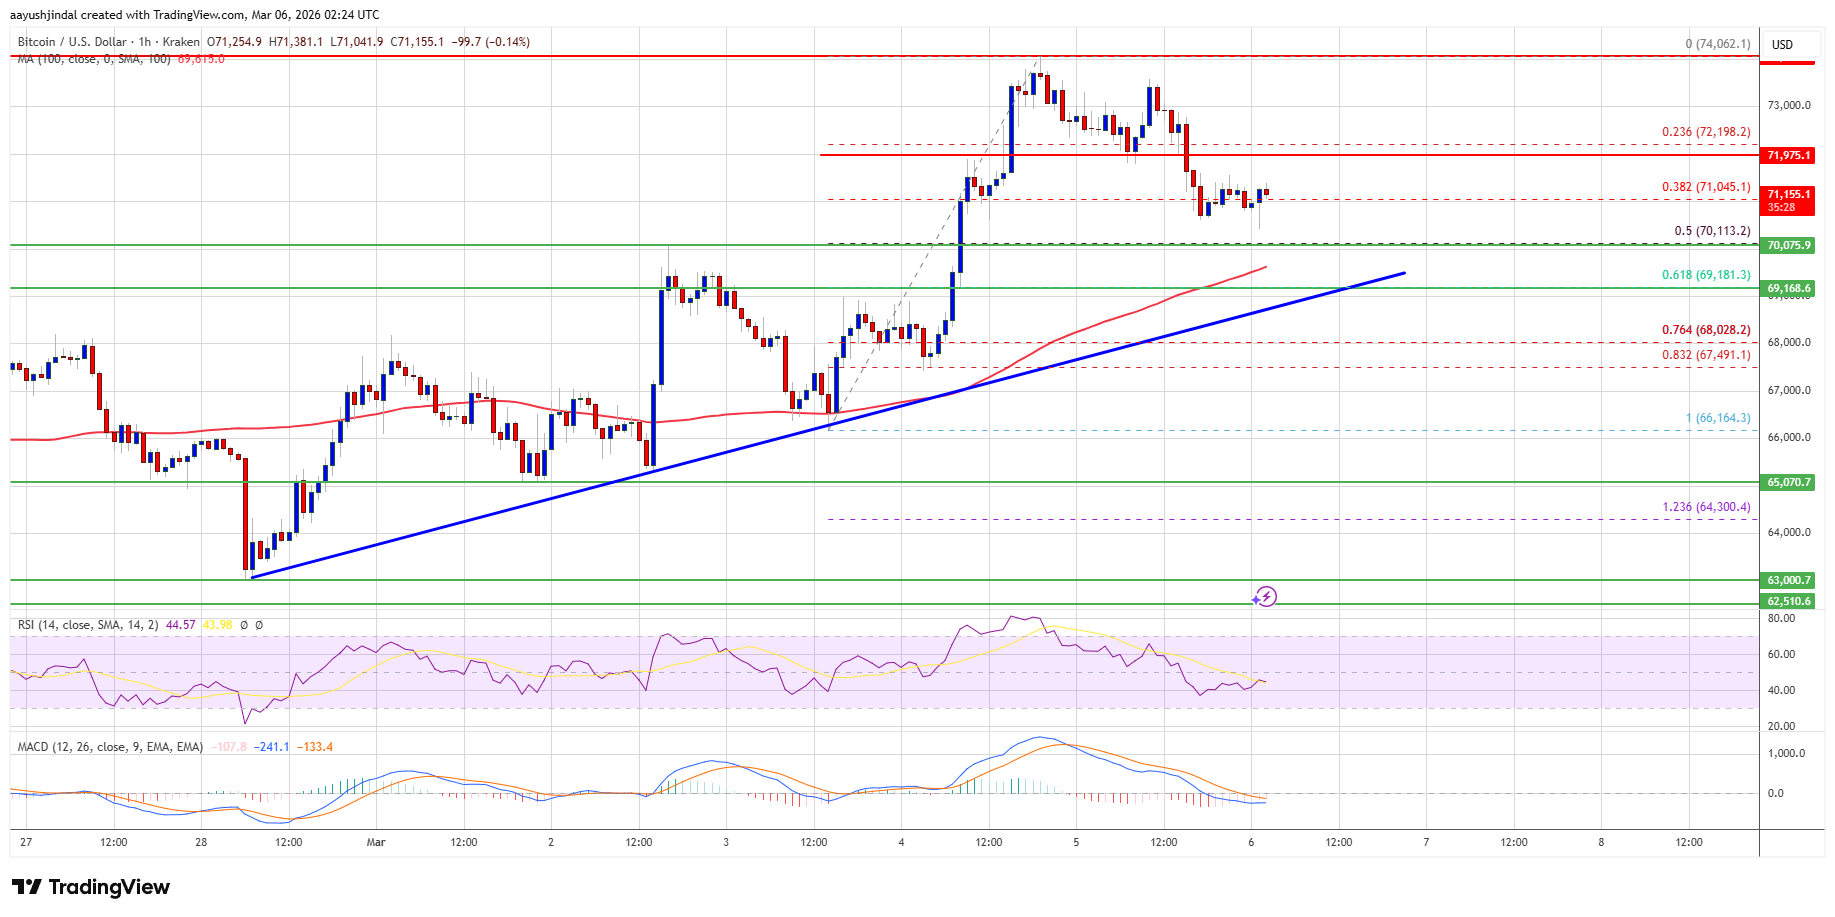
If the price remains stable above $70,000, it may attempt a new rally. Immediate resistance is near the $72,000 level. The first major resistance level is near the $72,500 level. If the price closes above the $72,500 resistance level, the price could move higher. In the above case, the price could rise and test the $73,200 resistance. Further gains could push the price closer to the $74,000 level. The next hurdles for the bulls could be $75,000 and $75,500.
Under price correction $BTC?
If Bitcoin fails to rise above the $72,000 resistance zone, a further decline could begin. Immediate support is near the $70,000 level, or the 50% Fib retracement level of the swing low of $66,164 to the high of $74,062. The first major support is near the $69,000 level.
The next support is currently located near the $68,500 zone. Any further losses could send the price towards the $68,000 support in the near term. The current major support is $66,200 and below it. $BTC Recovery may be difficult in the short term.
Technical indicators:
Hourly MACD – The MACD is currently losing pace in the bullish zone.
Hourly RSI (Relative Strength Index) – RSI $BTC/USD is currently below the 50 level.
Major support level – $70,000, then $69,000.
Key resistance levels – $72,000 and $72,500.