
Bitcoin traded at $66,424 on March 1, 2026 at 8:30 a.m. ET, holding within a defined intraday range of $63,886 to $68,043 as the broader structure remained under pressure. Although the short-term chart shows a stabilization in the range, the moving averages and momentum indicators remain defensive across time frames.
Bitcoin chart outlook
On the daily chart, Bitcoin maintains a bearish macro structure after falling from around $90,000 to a surrender low near $59,900, with price currently compressed between $63,000 support and $69,500 to $70,000 resistance. Although highs and lows continue to form near the top of the range, trading volume is decreasing as prices consolidate, indicating that the price is entering a compression phase.
The general pattern resembles a bearish flag or distribution range unless the price is able to decisively retake the $70,000 area. Until that happens, the wider structure will remain tilted downwards, regardless of intermittent bounces.
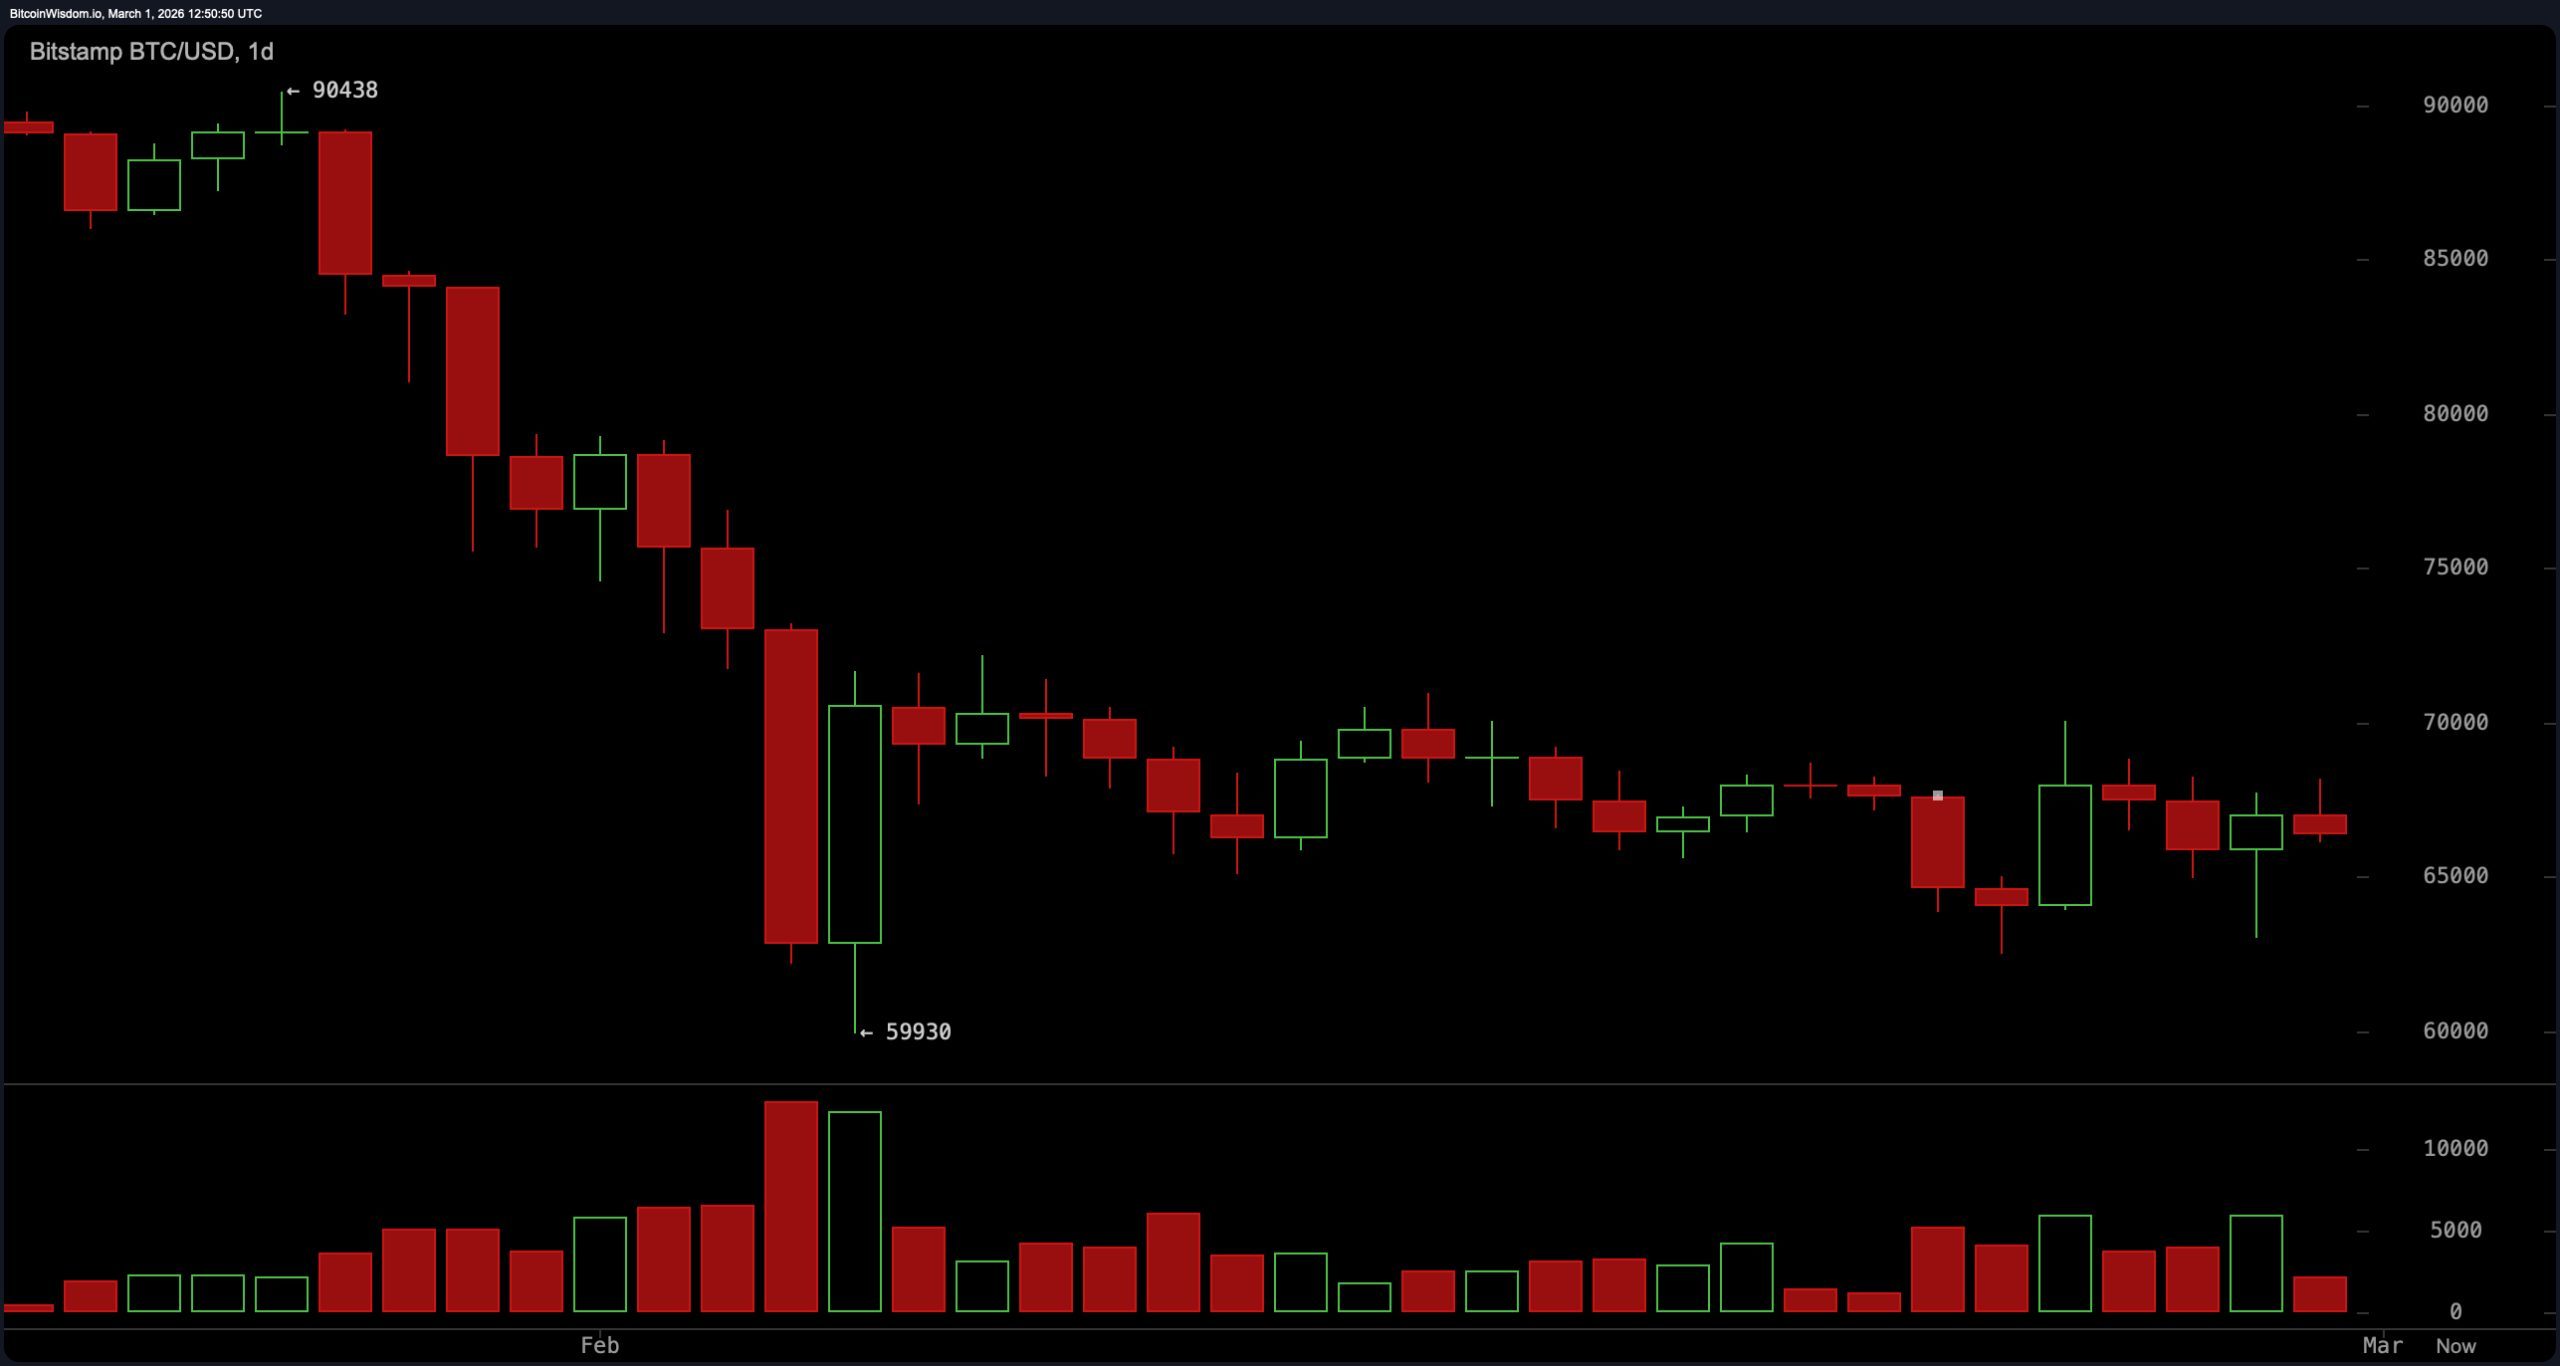
$BTC/USD 1-day chart via Bitstamp for March 1, 2026.
On the 4-hour chart, Bitcoin price rebounded from around $63,000, but was rejected around $70,000 and formed another low before falling again. Buyers repeatedly defended the $63,000-$64,000 zone, establishing it as a major intraday support cluster. Resistance is concentrated between $68,000 and $70,000, with $63,000 acting as a trigger for a structural break and $70,000 acting as a trigger for an upside break. Momentum is said to be slightly bearish unless the price regains $68,000 and continues to be accepted above that level. In other words, the range is intact, but it does not exude complete bullish conviction.
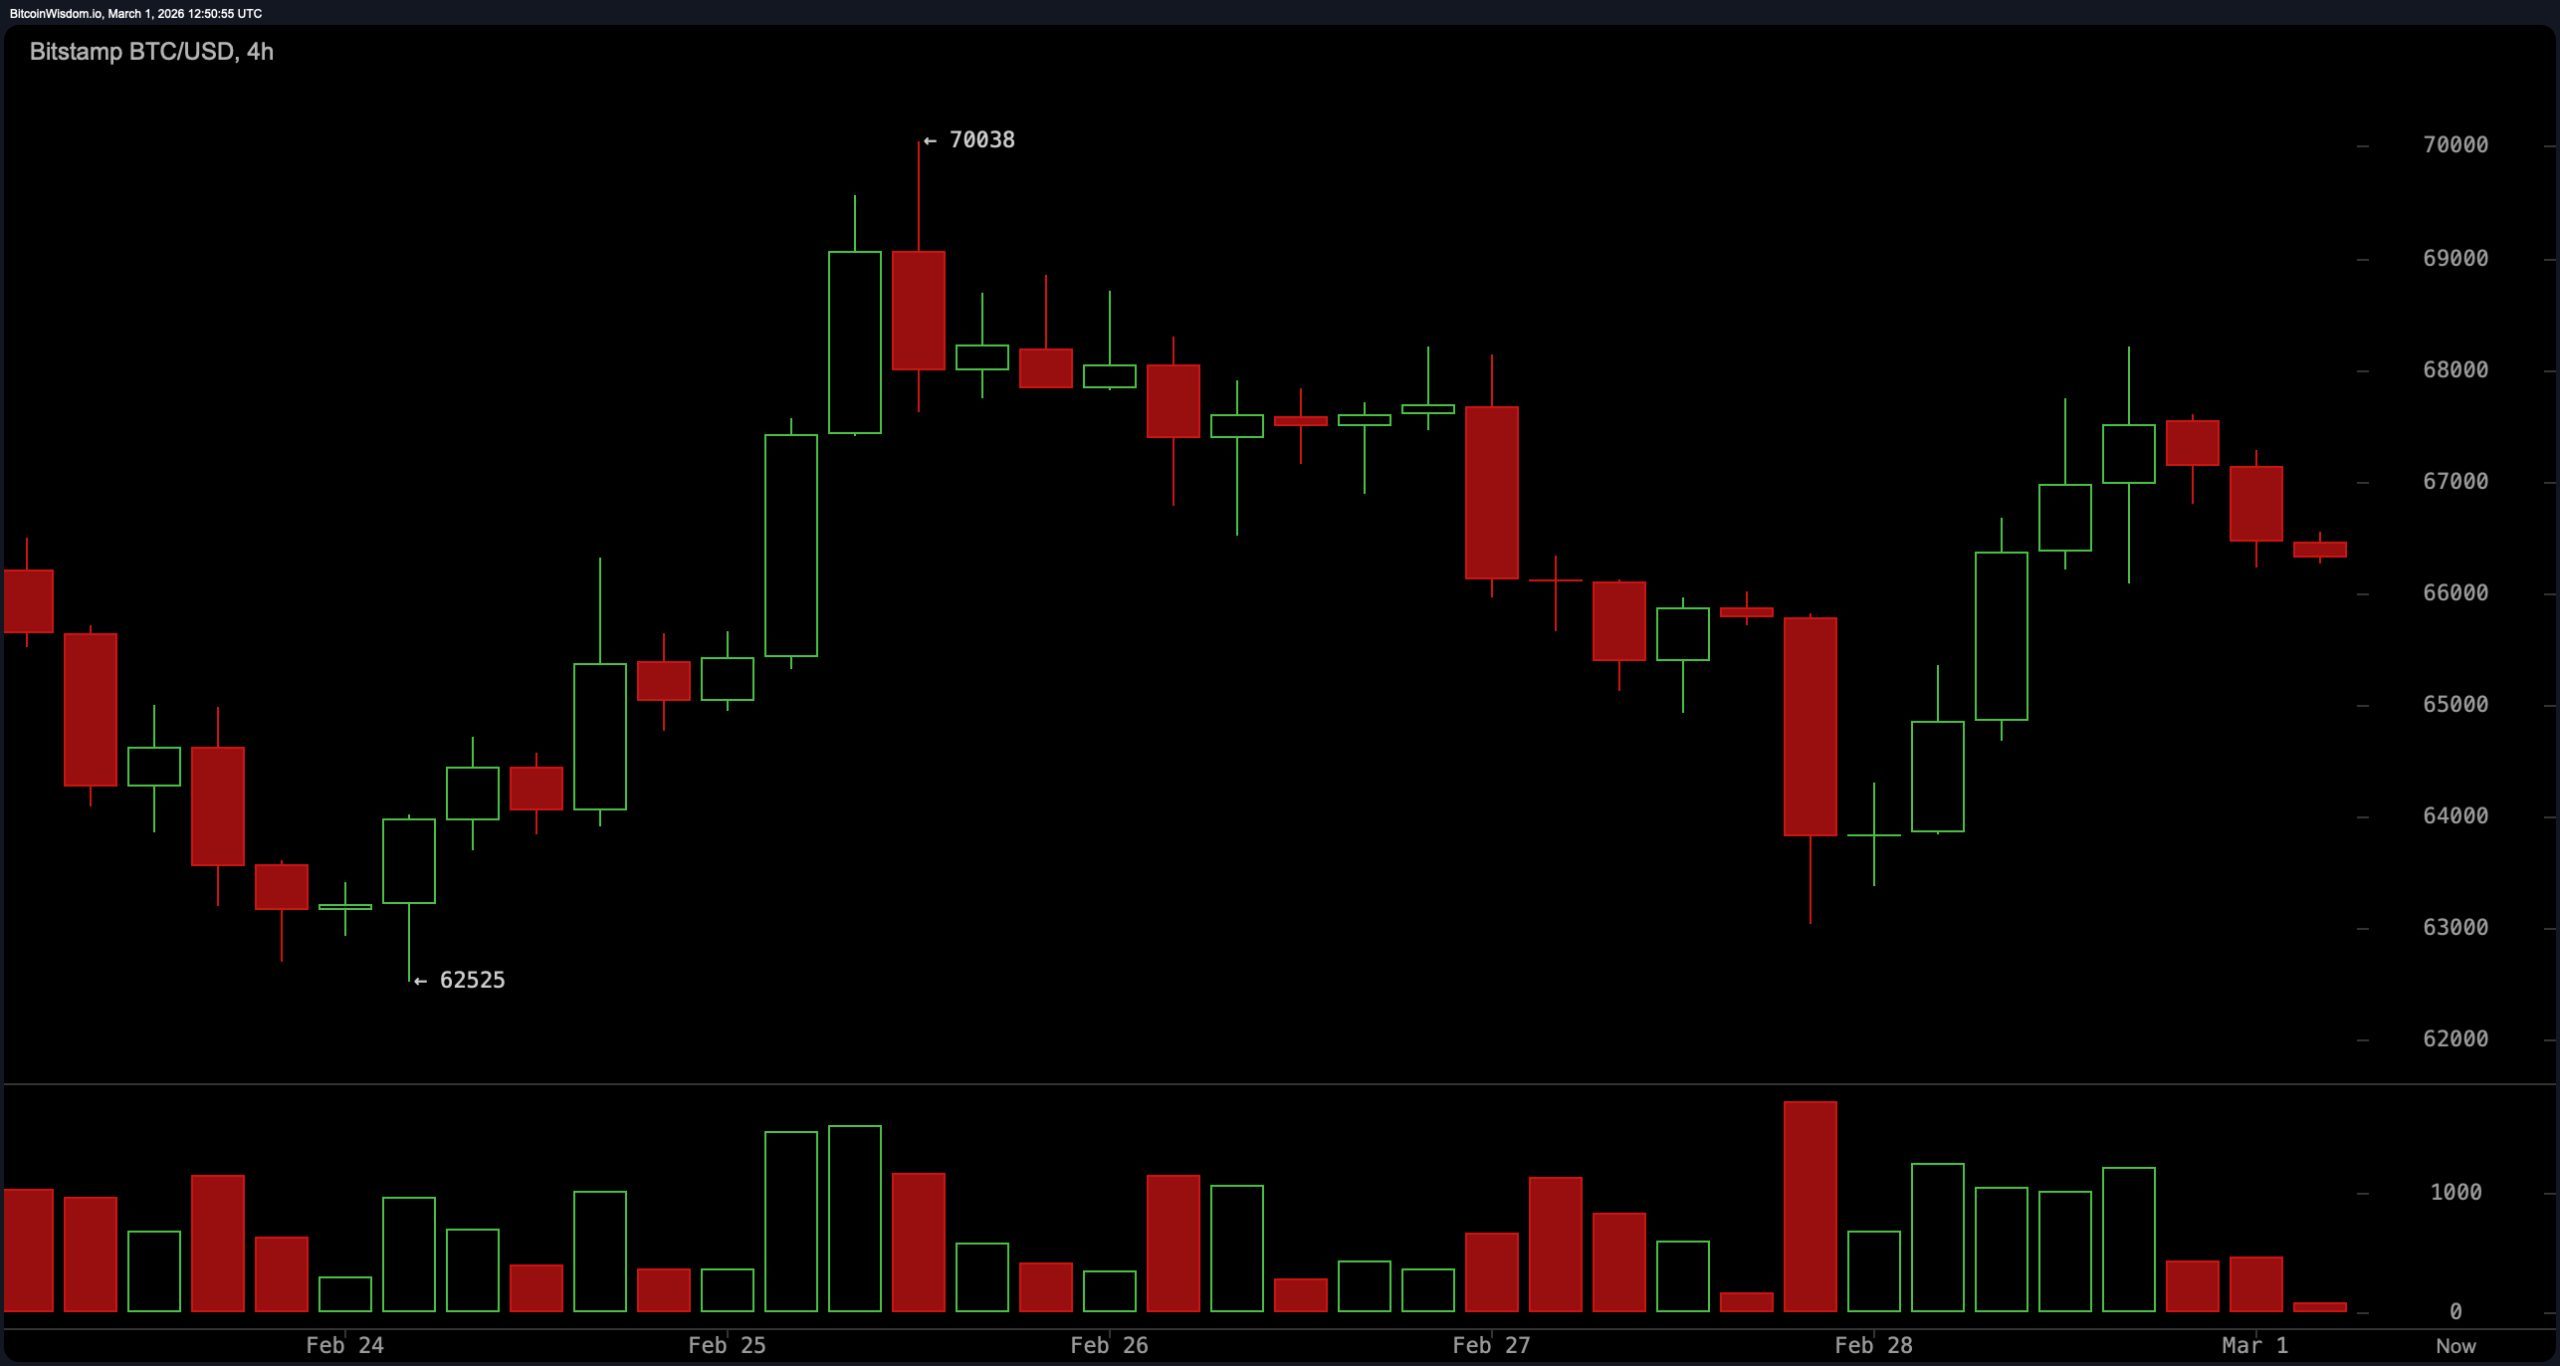
$BTC/USD 4-hour chart via Bitstamp on March 1, 2026.
On the 1-hour Bitcoin chart, you can see that it plummeted to $63,000, then made a clean high to $68,200, but then stalled and started forming a low around $67,000. The short-term trend has shifted from recovery mode to neutral to bearish, reflecting the cooling in momentum after a failed breakout attempt. An hourly close below $63,000 would confirm fresh downward pressure towards $61,000 and potentially $59,900, while a sustained rise above $68,500-$69,000 would reinstate the $70,000 test. This level of compression is typically done prior to decompression. The market is not sleeping, it is swirling.
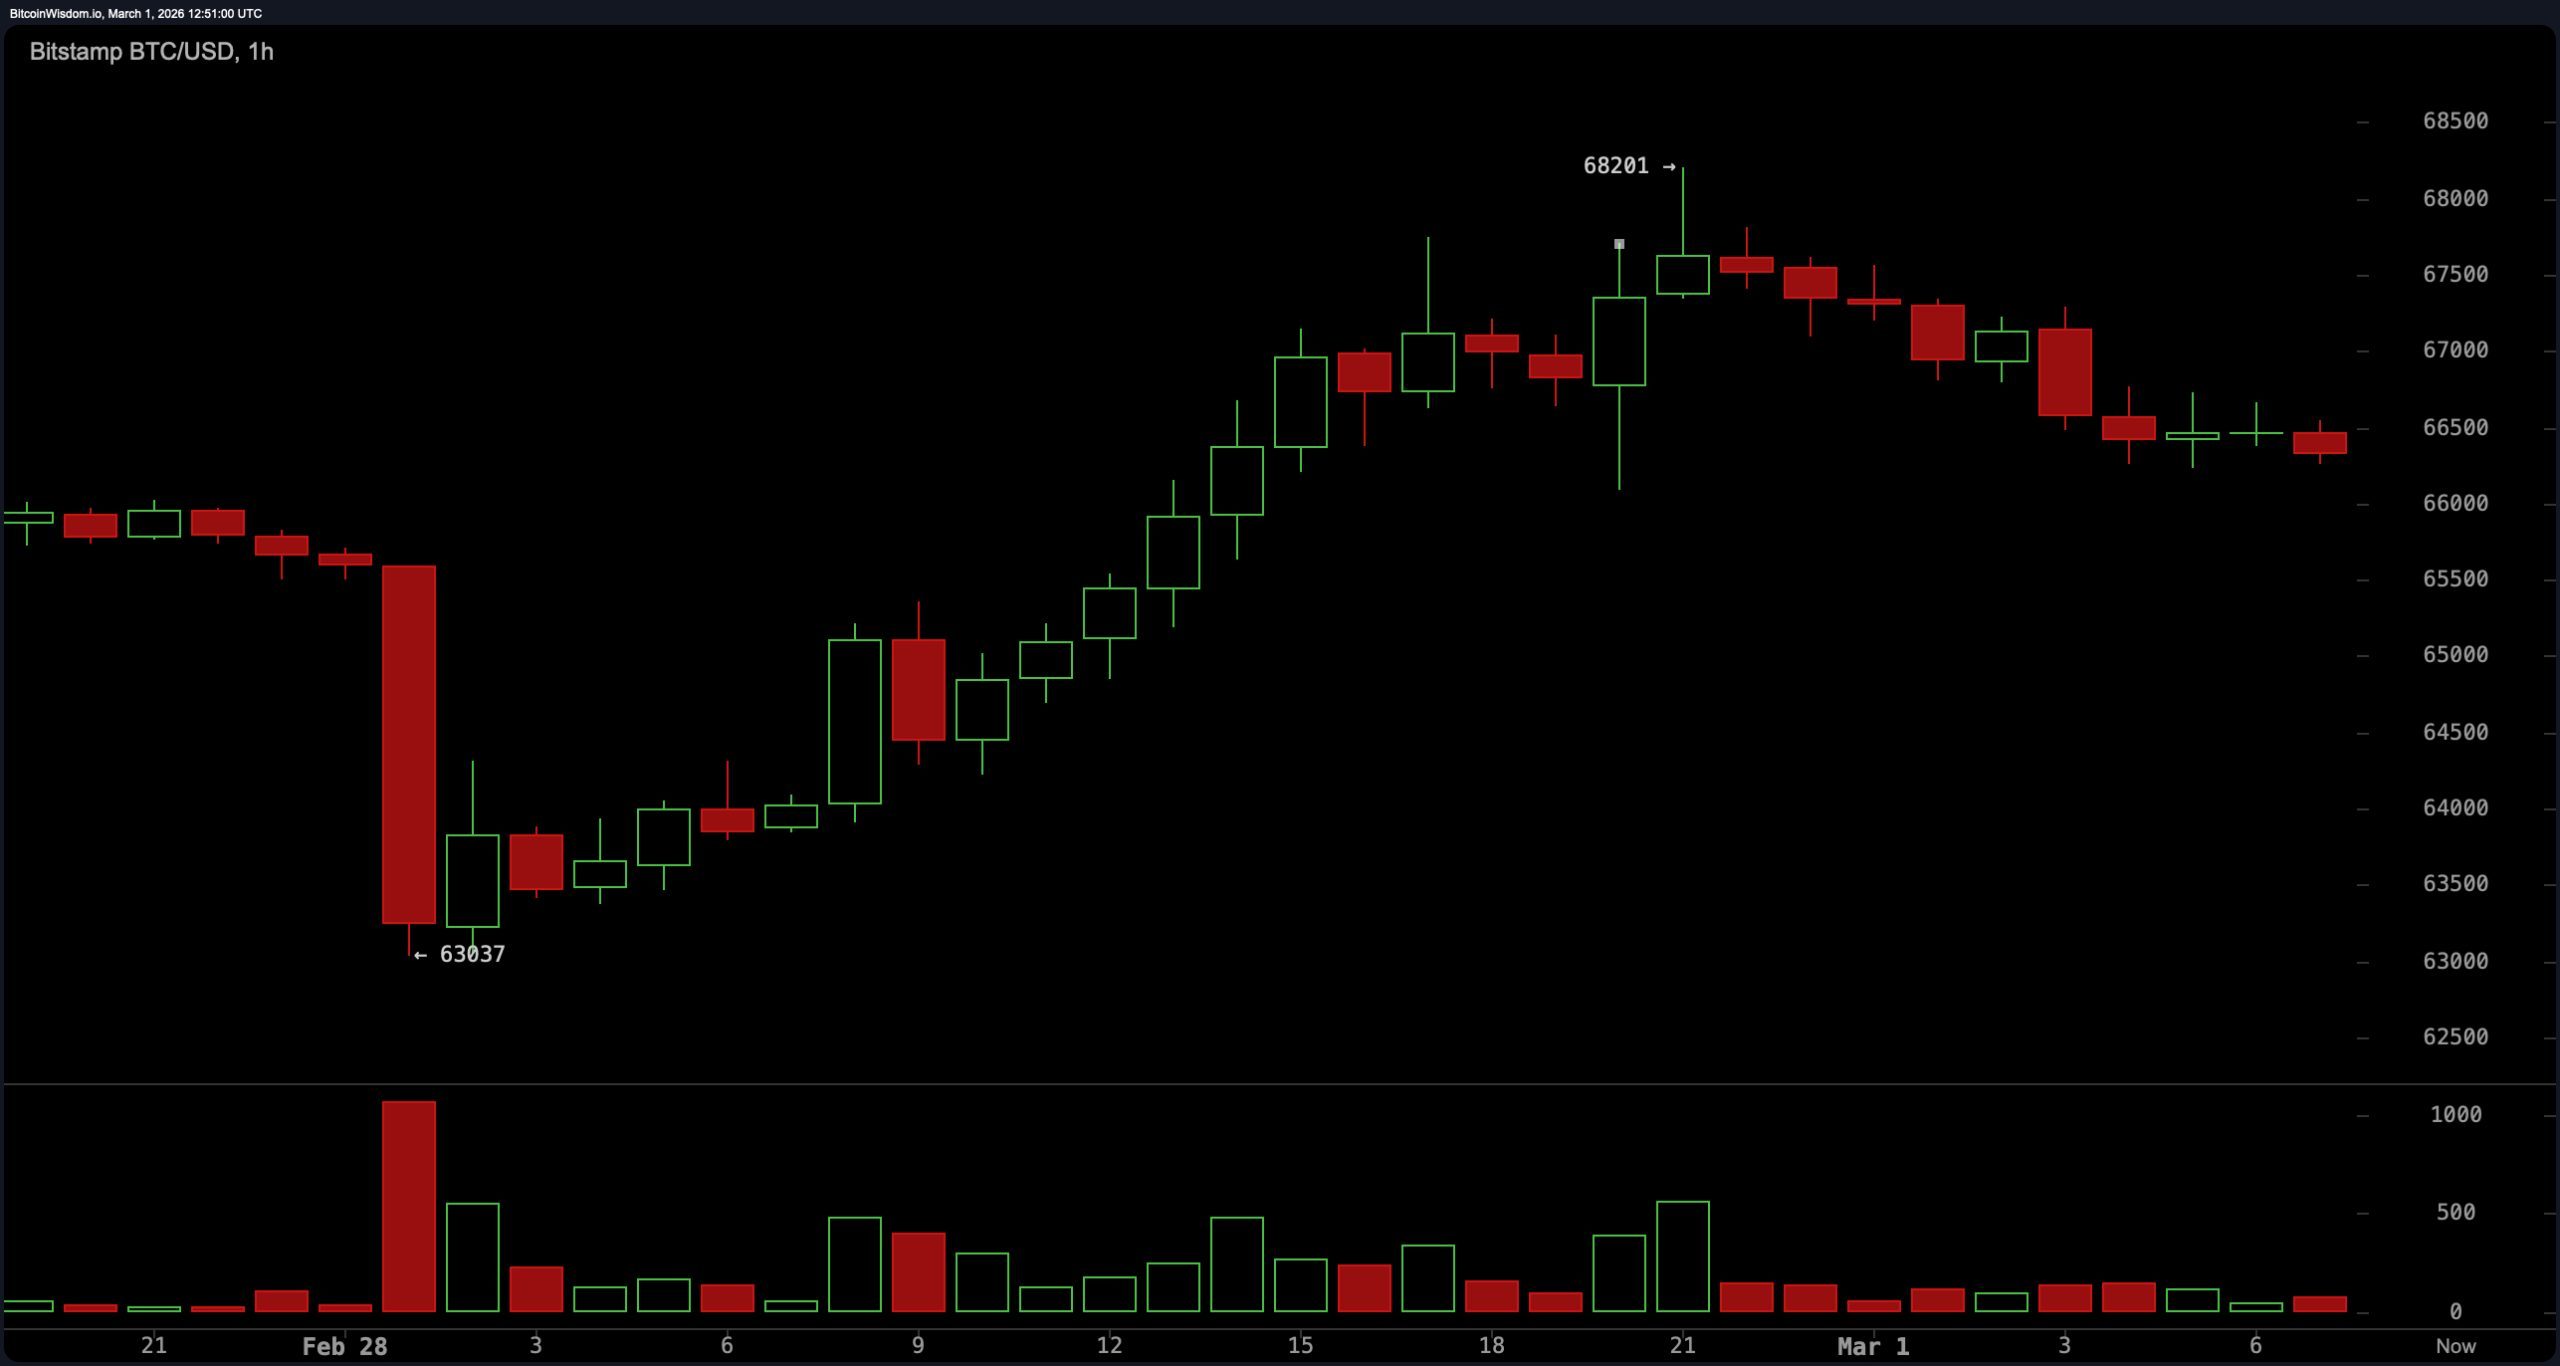
$BTC/USD 1-hour chart via Bitstamp on March 1, 2026.
The oscillators are mixed, but there is a cautious attitude. The Relative Strength Index (RSI) reads 40, the Stochastic Oscillator reads 48, and the Commodity Channel Index (CCI) reads -29, all of which are classified as neutral. The Average Directional Index (ADX) of 50 indicates trend strength without directional bias, while the Awesome Oscillator registers negative 4,465 in neutral territory.
Momentum shows a negative reading of 604 with a downside signal, while the Moving Average Convergence Divergence (MACD) level shows a negative reading of 2,772 with an upside signal. This divergence between MACD and actual momentum indicates an internal conflict. Trend pressure remains, but directional confidence has broken.
However, the moving average (MA) is clear. Bitcoin trades below all listed Exponential Moving Averages (EMAs) and Simple Moving Averages (SMAs) from short to long term. The 10-day EMA is $66,836 and the 10-day SMA is $66,696. The 20-day EMA is $68,457 and the 20-day SMA is $67,308.
The 30-day EMA is $70,753 and the 30-day SMA is $69,065. Additionally, the 50-day EMA is $74,999 and the 50-day SMA is $77,725, while the 100-day EMA is $82,698 and the 100-day SMA is $83,553. The 200-day EMA is trading at $90,553 and the 200-day SMA is $97,085. Both suggest downward pressure. If the price is below all major moving averages on the curve, the burden of proof is firmly on the bulls’ side, which requires a sustained break above $70,000.
Bullish verdict:
A sustained break-and-hold above $70,000, confirmed by a strong 1-hour close with expanding volume, would invalidate the current low-to-high structure and suggest a structural change on the 4-hour and daily charts. Such a move would push the price back above short-term resistance and begin to challenge the overhead cumulative moving average, paving the way for $72,000 and potentially $75,000. However, the upside is conditional and not set in stone until the $70,000 is definitively recovered.
Bear verdict:
Failure to defend $63,000 would confirm a continuation of the broader downtrend seen on the daily chart, especially if there are many 1-hour closes below that level. Since the price is already trading below all major exponential moving averages and the 10-day to 200-day simple moving average, the breakdown could be $61,000 first, then $59,900, and if volatility widens, $56,000. Structurally, the trend favors a downside resolution unless the $70,000 resistance is cleared by authorities.
Frequently asked questions 🔎
- What is the price of Bitcoin on March 1, 2026? Bitcoin is trading at $66,424, with a 24-hour range of $63,886 to $68,043.
- Is Bitcoin currently in a bullish or bearish trend? Bitcoin remains in a broad bearish structure, trading below all major exponential and simple moving averages.
- What are Bitcoin’s major support and resistance levels? Immediate support lies at $63,000, while major resistance is concentrated between $69,500 and $70,000.
- What signals could trigger Bitcoin’s next big move? A confirmed breakout above $70,000 or a confirmed breakout below $63,000 could trigger the next volatility expansion move.