
It looks like the king of cryptocurrencies has hit the snooze button. As of January 11, 2026, Bitcoin is trading at $90,828, with a 24-hour intraday range of $90,291 to $90,850. With a market capitalization of $1.81 trillion and daily trading volume of $14.26 billion, Bitcoin sits firmly on its throne and cautiously surveys the battlefield.
Bitcoin chart outlook
From the daily chart, Bitcoin appears to be recovering from its recent decline, forming a V-shaped rebound between $84,398 and recent highs of $94,792. The price movement currently hovering around $90,500 is characterized by small candlesticks, indicating a lot of market hesitation or “meh.”
With strong support between $84,500 and $85,000 and resistance between $94,500 and $95,000, traders are keeping an eye on a potential rebound from the bulls to see if they can shake off their weekend hangover. Calm volume could mean the market is preparing for its next move or taking a breather after a sprint.
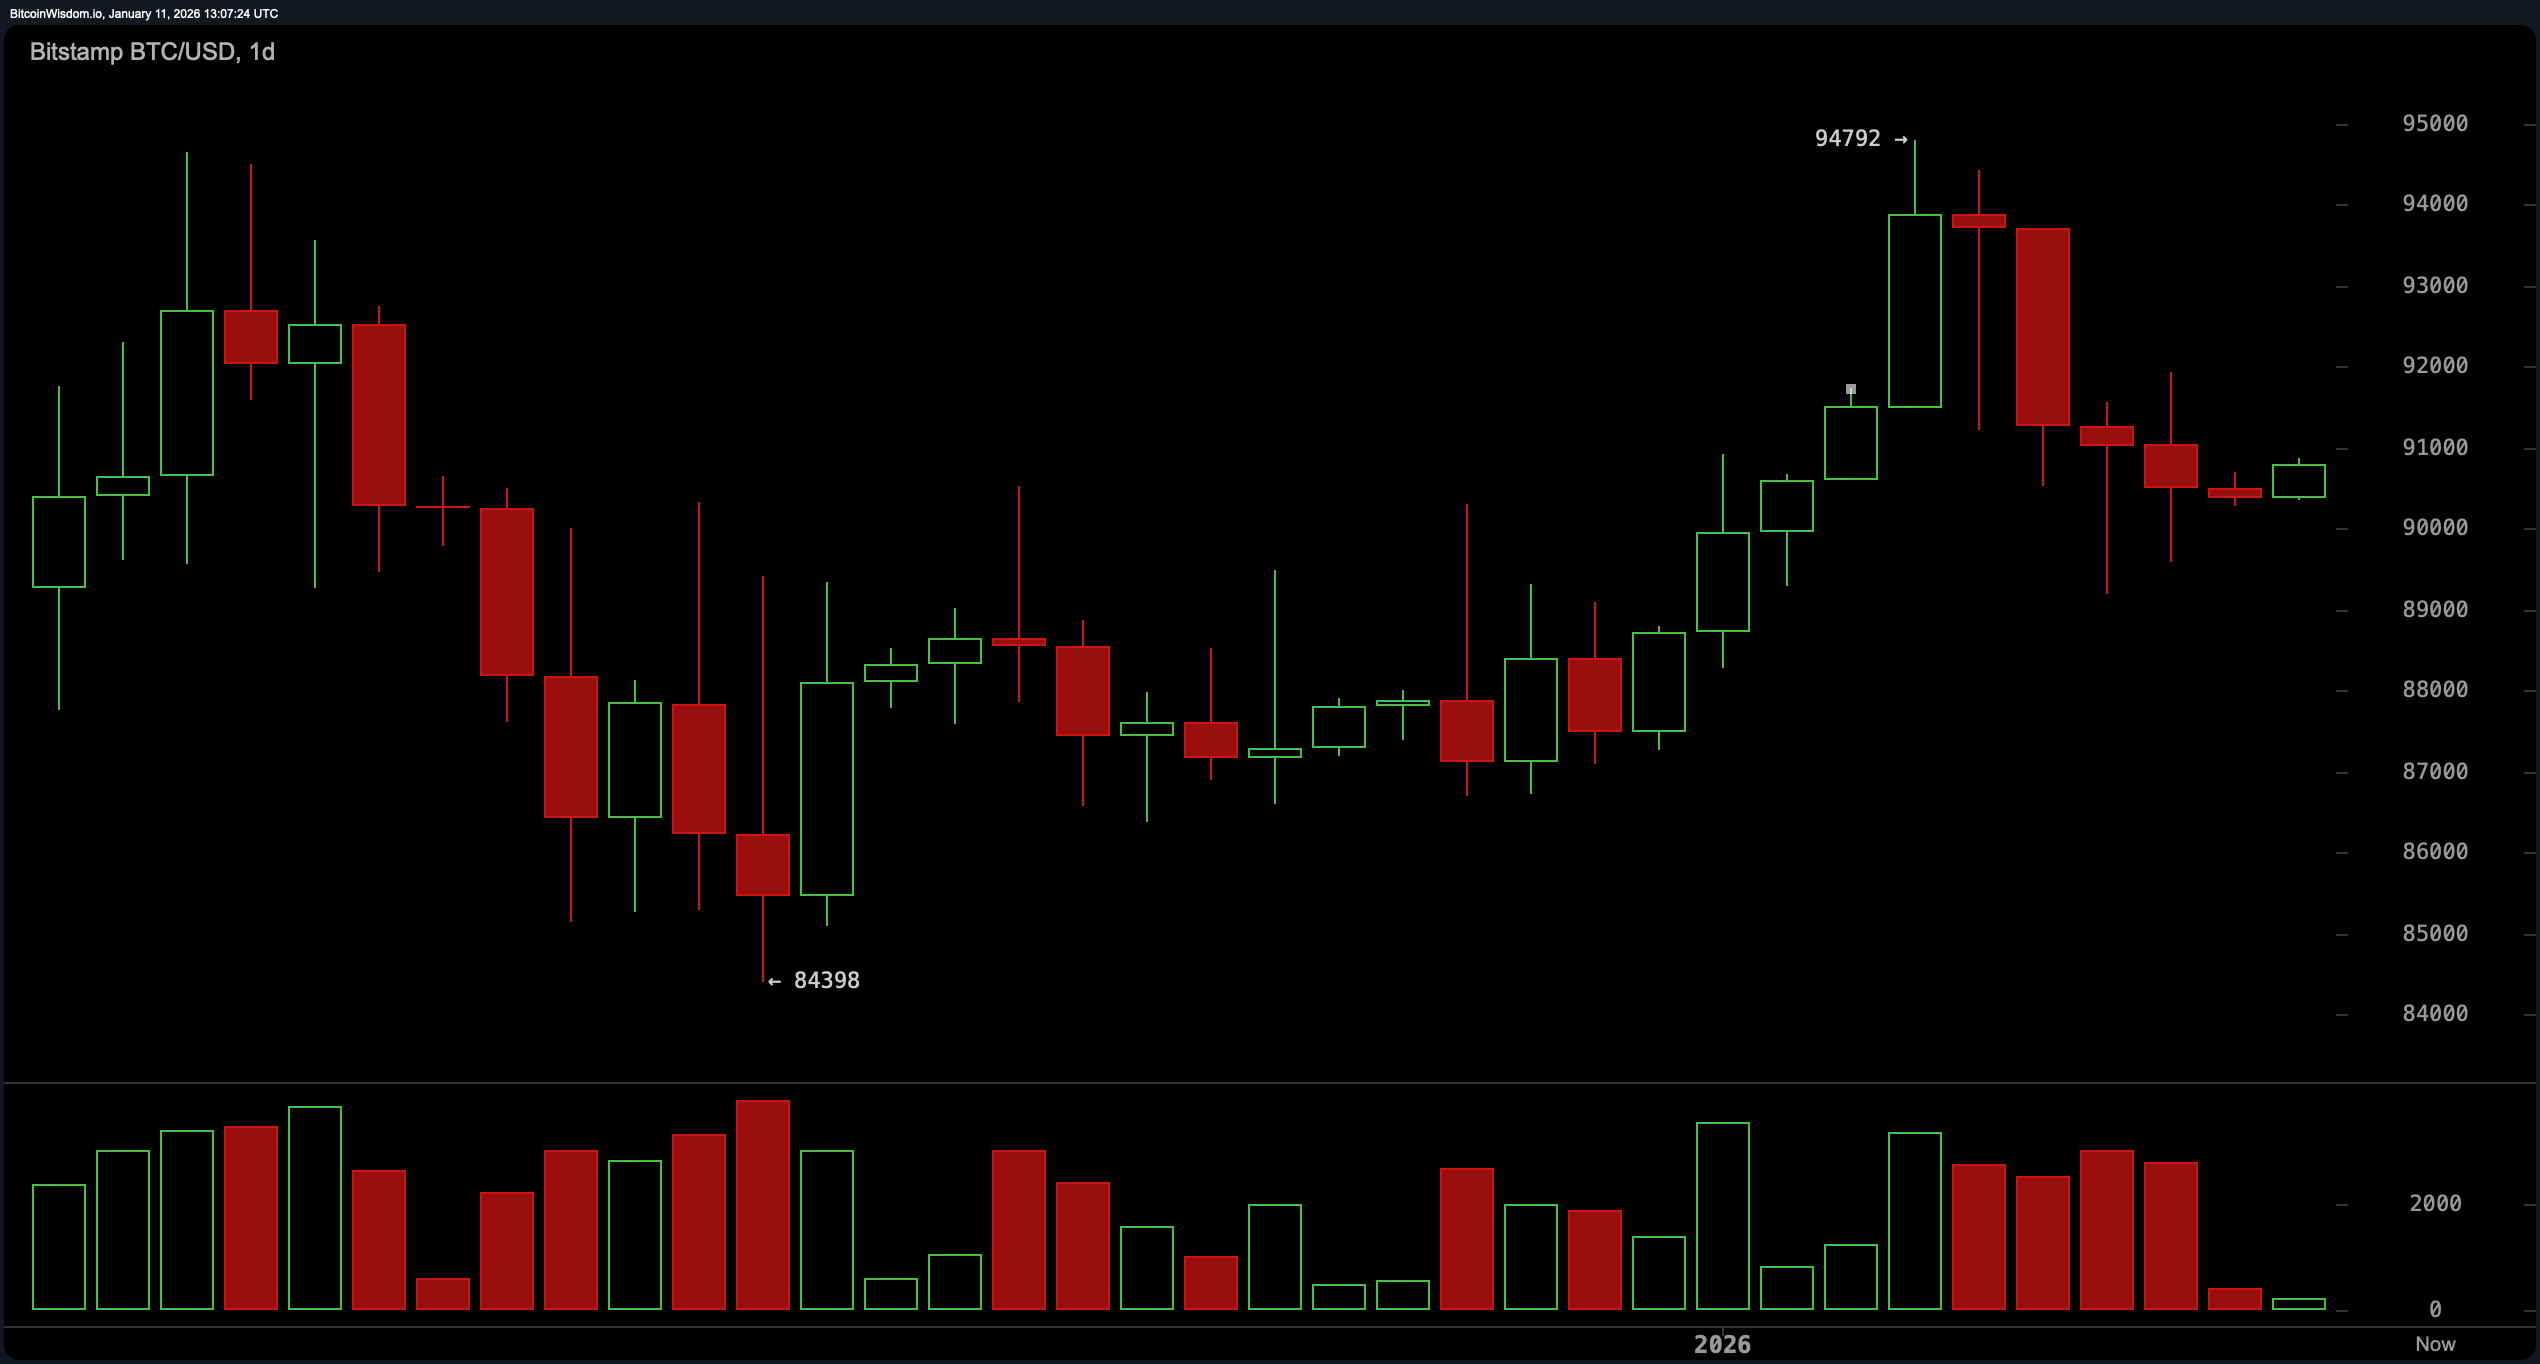
BTC/USD 1-day chart via Bitstamp for January 11, 2026.
On the 4-hour chart, the situation is sideways like a crab on roller skates. Bitcoin’s recent decline bottomed out at $89,199, suggesting a flicker of buying interest. Since then, prices have been stuck in a consolidation phase within a descending channel that has started to level out. The volume is gradually decreasing, which always indicates that neither side wants a showdown. However, the next spark could be above $91,000, which would indicate that the bulls have found the courage (and perhaps a double shot of espresso).
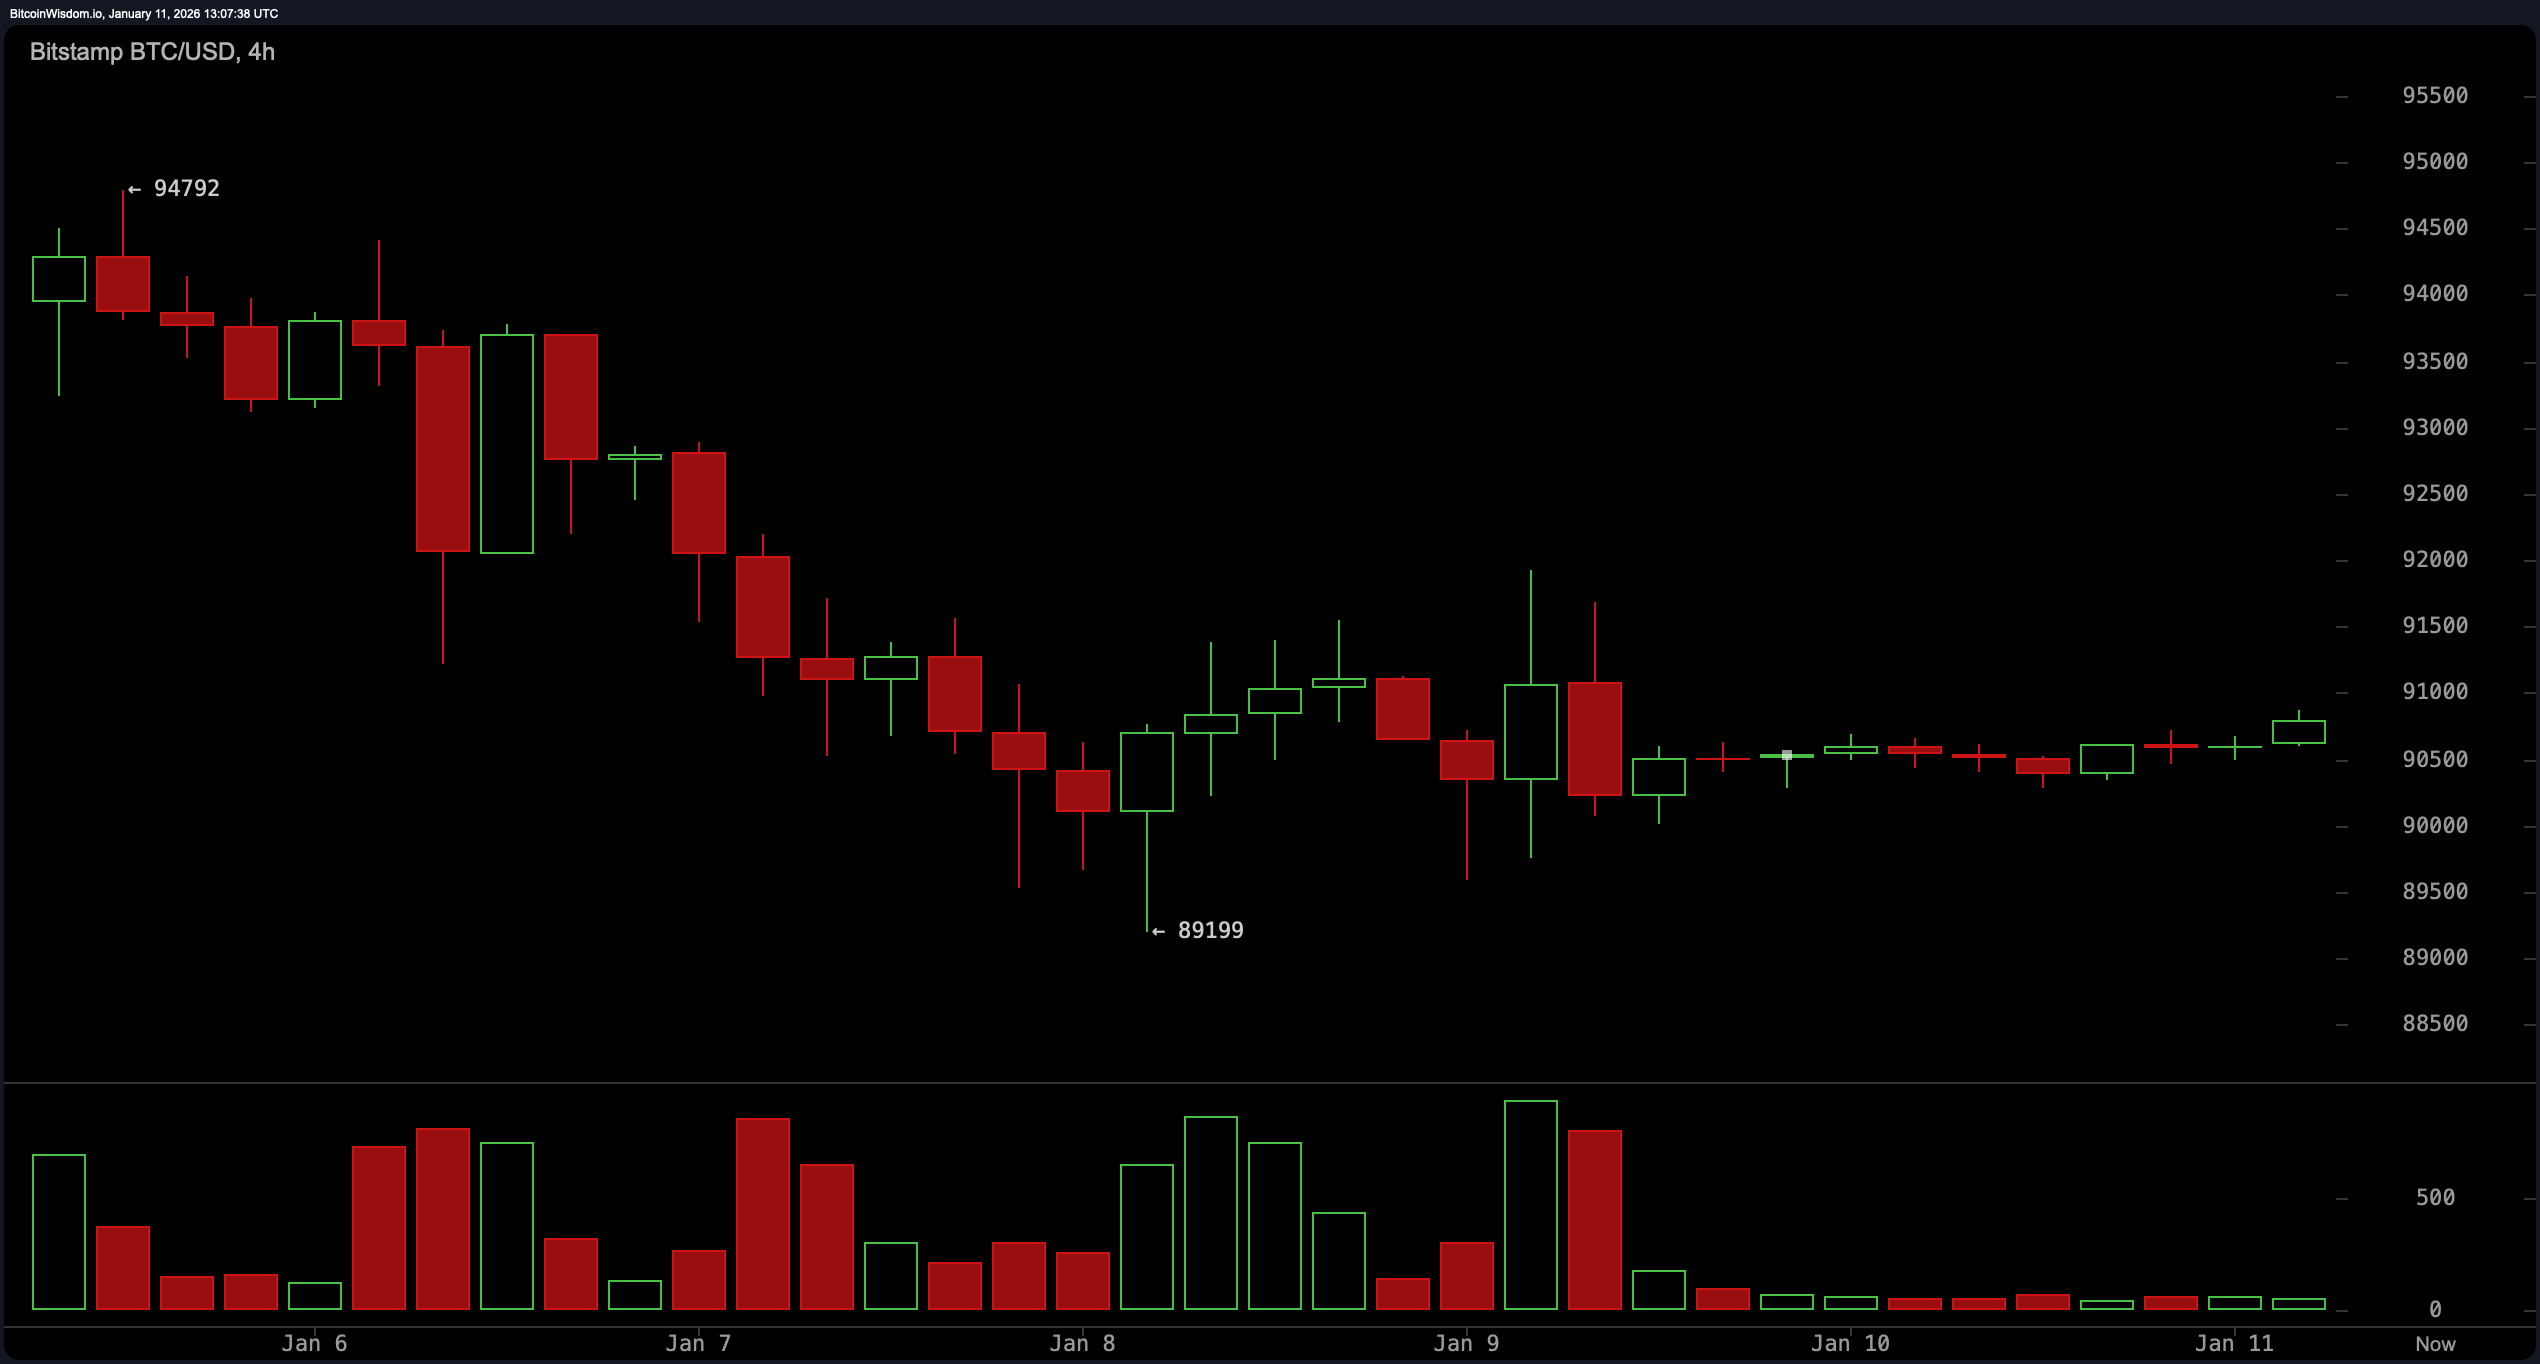
BTC/USD 4-hour chart via Bitstamp on January 11, 2026.
Zooming in on the hourly chart, Bitcoin is within a narrow range of $600. The recent rally to $90,867, coupled with a surge in volume, suggests a possible short-term reversal. Still, barring a breakout above $91,000 supported by strong volume, this could be just a tease. A rounded bottom pattern may be in play and suggest accumulation, but confirmation is important. Scalpers are eyeing a clean price move above $90,900, but weak volume could deflate the rally faster than a January party balloon.
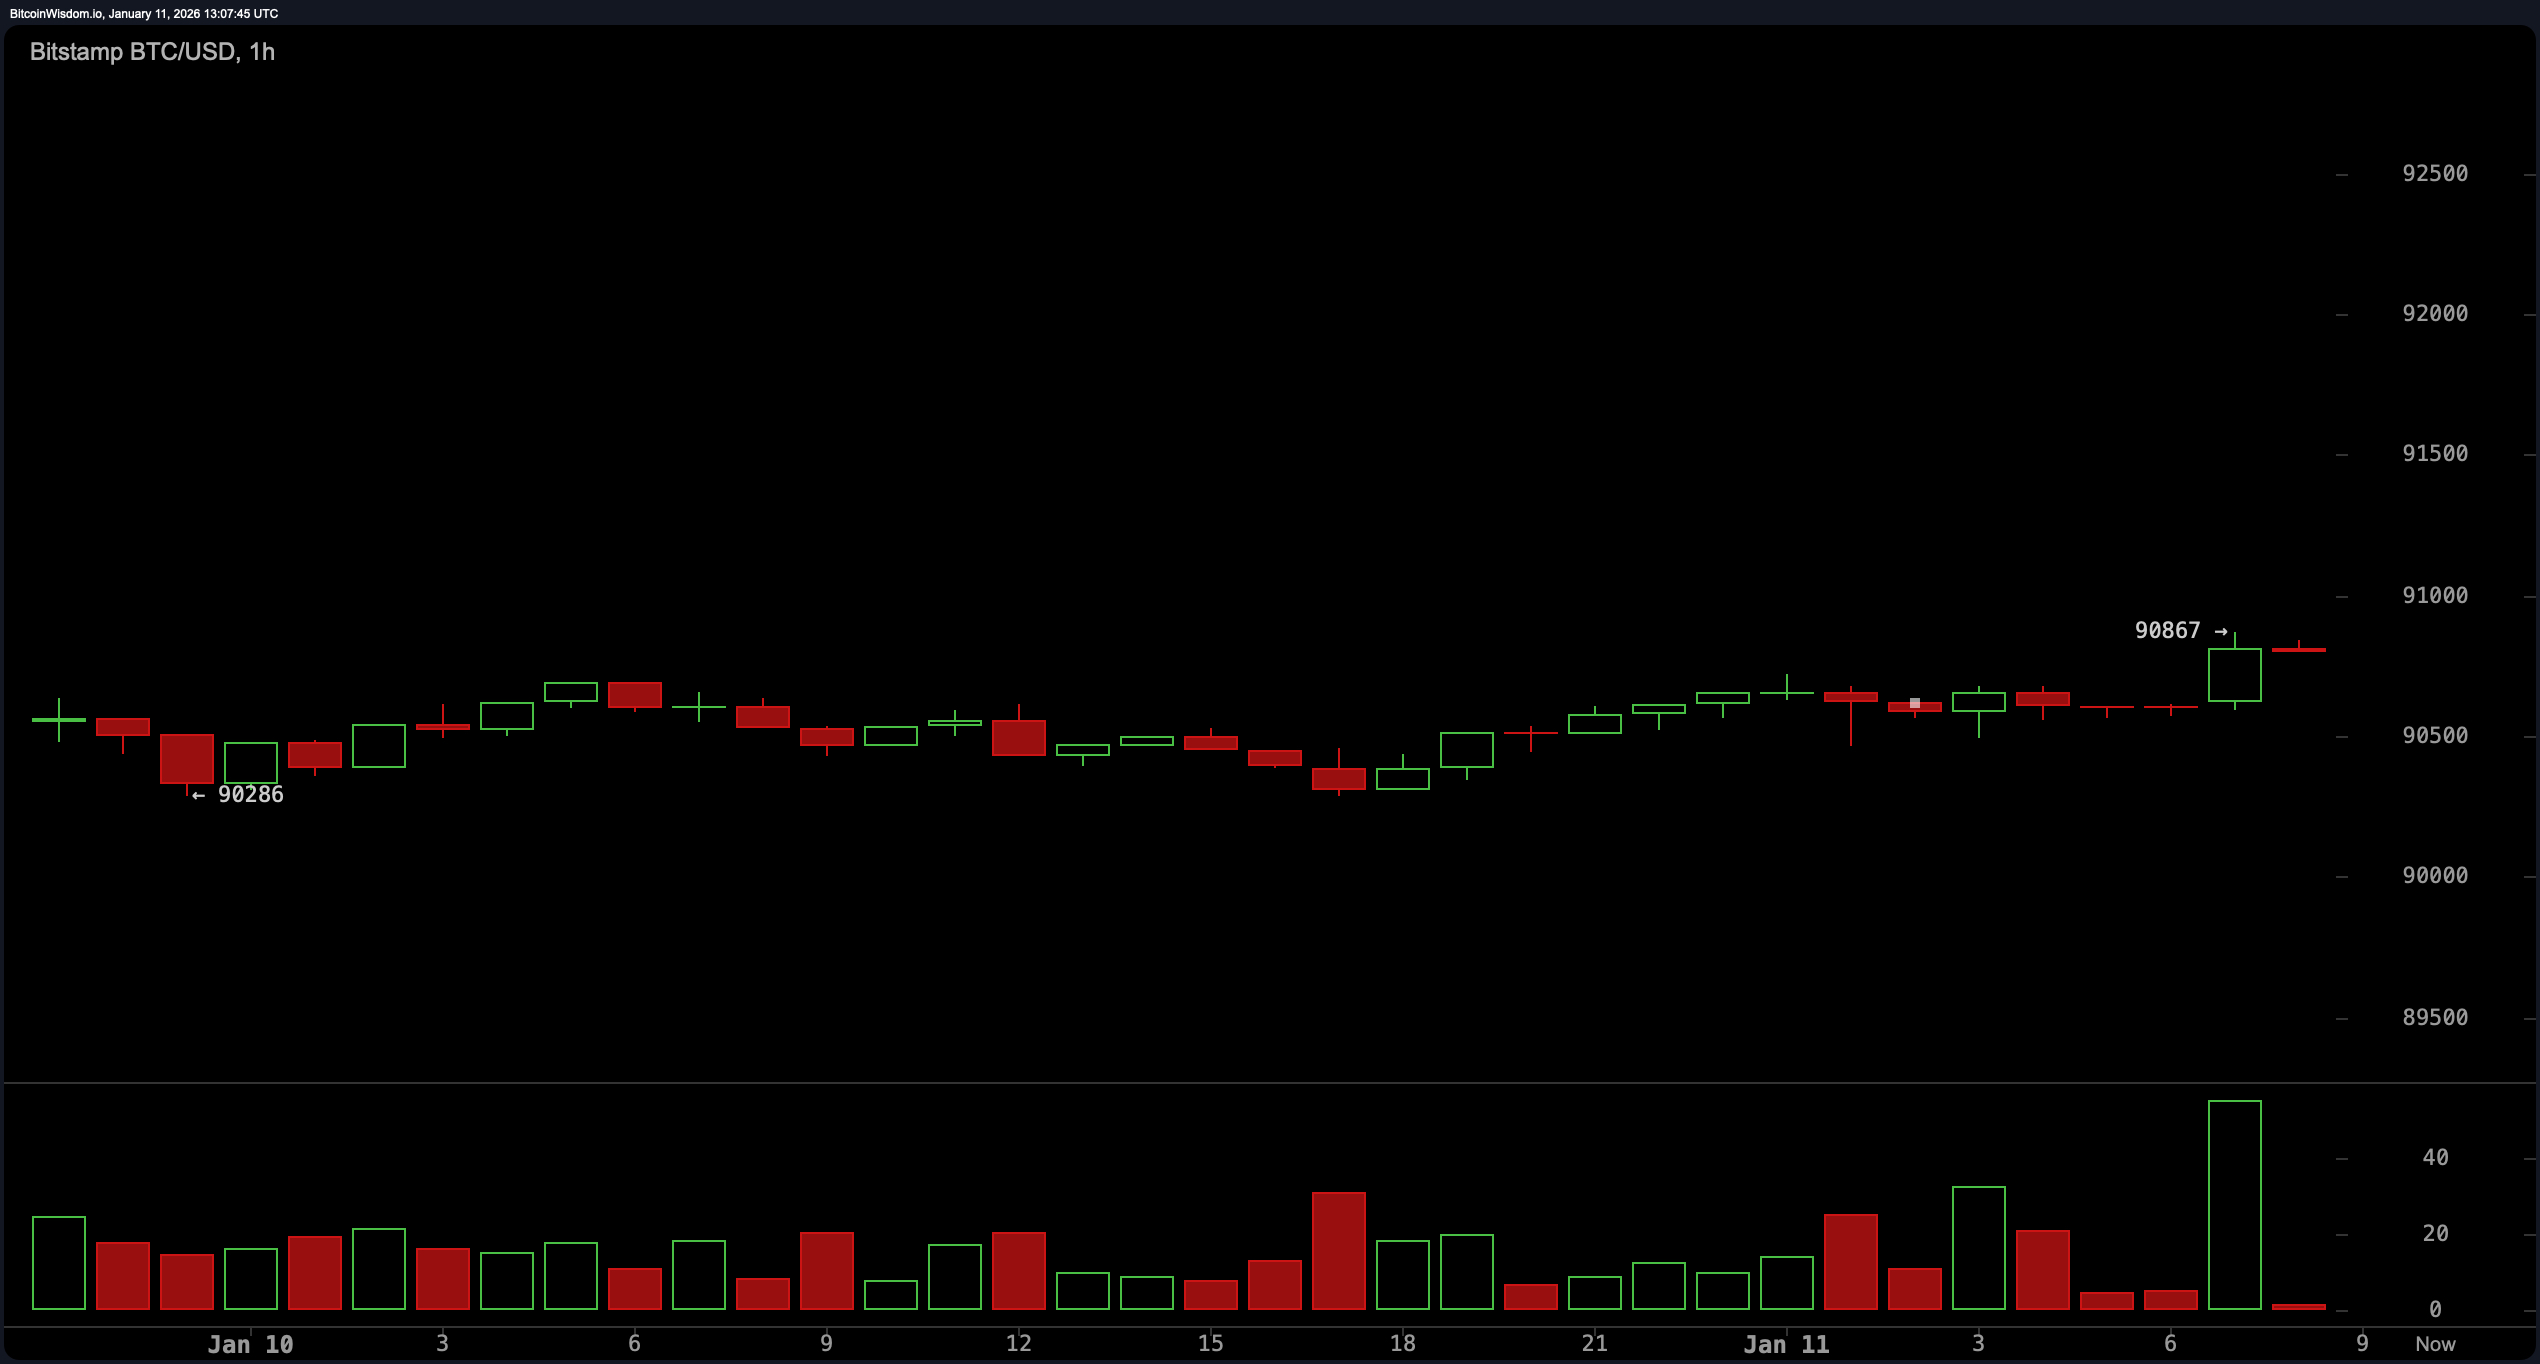
BTC/USD 1 hour chart via Bitstamp for January 11, 2026.
Oscillators aren’t necessarily cheering from the sidelines. The Relative Strength Index (RSI) is showing neutrality at 53, and the Stochastic Oscillator is also resting at 48, which is also neutral. The Commodity Channel Index (CCI) remains at 46, while the Average Directionality Index (ADX) shows a value of 25, reflecting low trend strength. Momentum is falling at 2,078, indicating fading bearish signs, but the Moving Average Convergence Divergence (MACD) level is at 475, hinting at a bit of bullish optimism. Overall, there is a “we’ll get back to you” vibe among the oscillators.
Looking at the moving average (MA) shows a mix of signals and cheekiness. The 10-period short-term exponential moving average (EMA) supports further upside at 90,740, while the simple moving average (SMA) for the same period is bearish at 91,363. In the 20 to 50 period zone, most of the moving averages are bullish, including the EMA (20) at 90,189 and the SMA (20) at 89,527. But things get worse as we go further. The 100-period EMA and SMA are 96,084 and 98,210, respectively, and the 200-period EMA and SMA are 99,744 and 106,258, both on the bearish side, suggesting that the long-term outlook is less pop and more fizz, at least for now.
In summary, Bitcoin is calm with a slight bullish tone across the intraday chart, but traders should keep an eye on the $89,000 floor and $91,000 ceiling. A breakout in either direction could set the tone for the next leg. Until then, this sideways walk continues, with market sentiment best described as cautiously curious.
Bullish verdict:
If Bitcoin can muster the strength to break through the $91,000 resistance with convincing volume, it could be the start of a new bull market. With most of the short-to-medium-term moving averages aligning with support and the oscillator trending cautiously optimistic, this setup favors those seeking continuation, assuming the bulls can continue to get their caffeine fix. A path to $94,000-$95,000 isn’t guaranteed, but it certainly gets you noticed.
Bear verdict:
If the $89,000 to $90,000 zone fails to hold, Bitcoin could fall toward the $85,000 support area or, in the worst case, return to the $84,000 handle. With the long-term moving average flashing red and losing momentum, a significant drop in volume could open the door to further downside. The bears are not completely under control, but they are circling and waiting for the slide.
Frequently asked questions ❓
- What is the current price of Bitcoin? Bitcoin is trading at $90,828 as of January 11, 2026.
- What is the intraday price range for Bitcoin today? Bitcoin’s 24-hour range is between $90,291 and $90,850.
- Is Bitcoin trending up or down now? Bitcoin is holding steady with a slight bullish bias across the short-term chart.
- Which key levels should traders focus on?For the next breakout, keep an eye on the support at $89,000 and resistance near $91,000.