Bitcoin continues to trade within a definitive correction structure, putting pressure on the major resistance block between $91,000 and $93,000 after a sharp pullback. Despite the recent recovery, the overall trend remains tilted to the downside, and the daily chart suggests that BTC is approaching a confluence region where the next major directional move is likely to be determined.
Bitcoin technical analysis
Written by Shayan
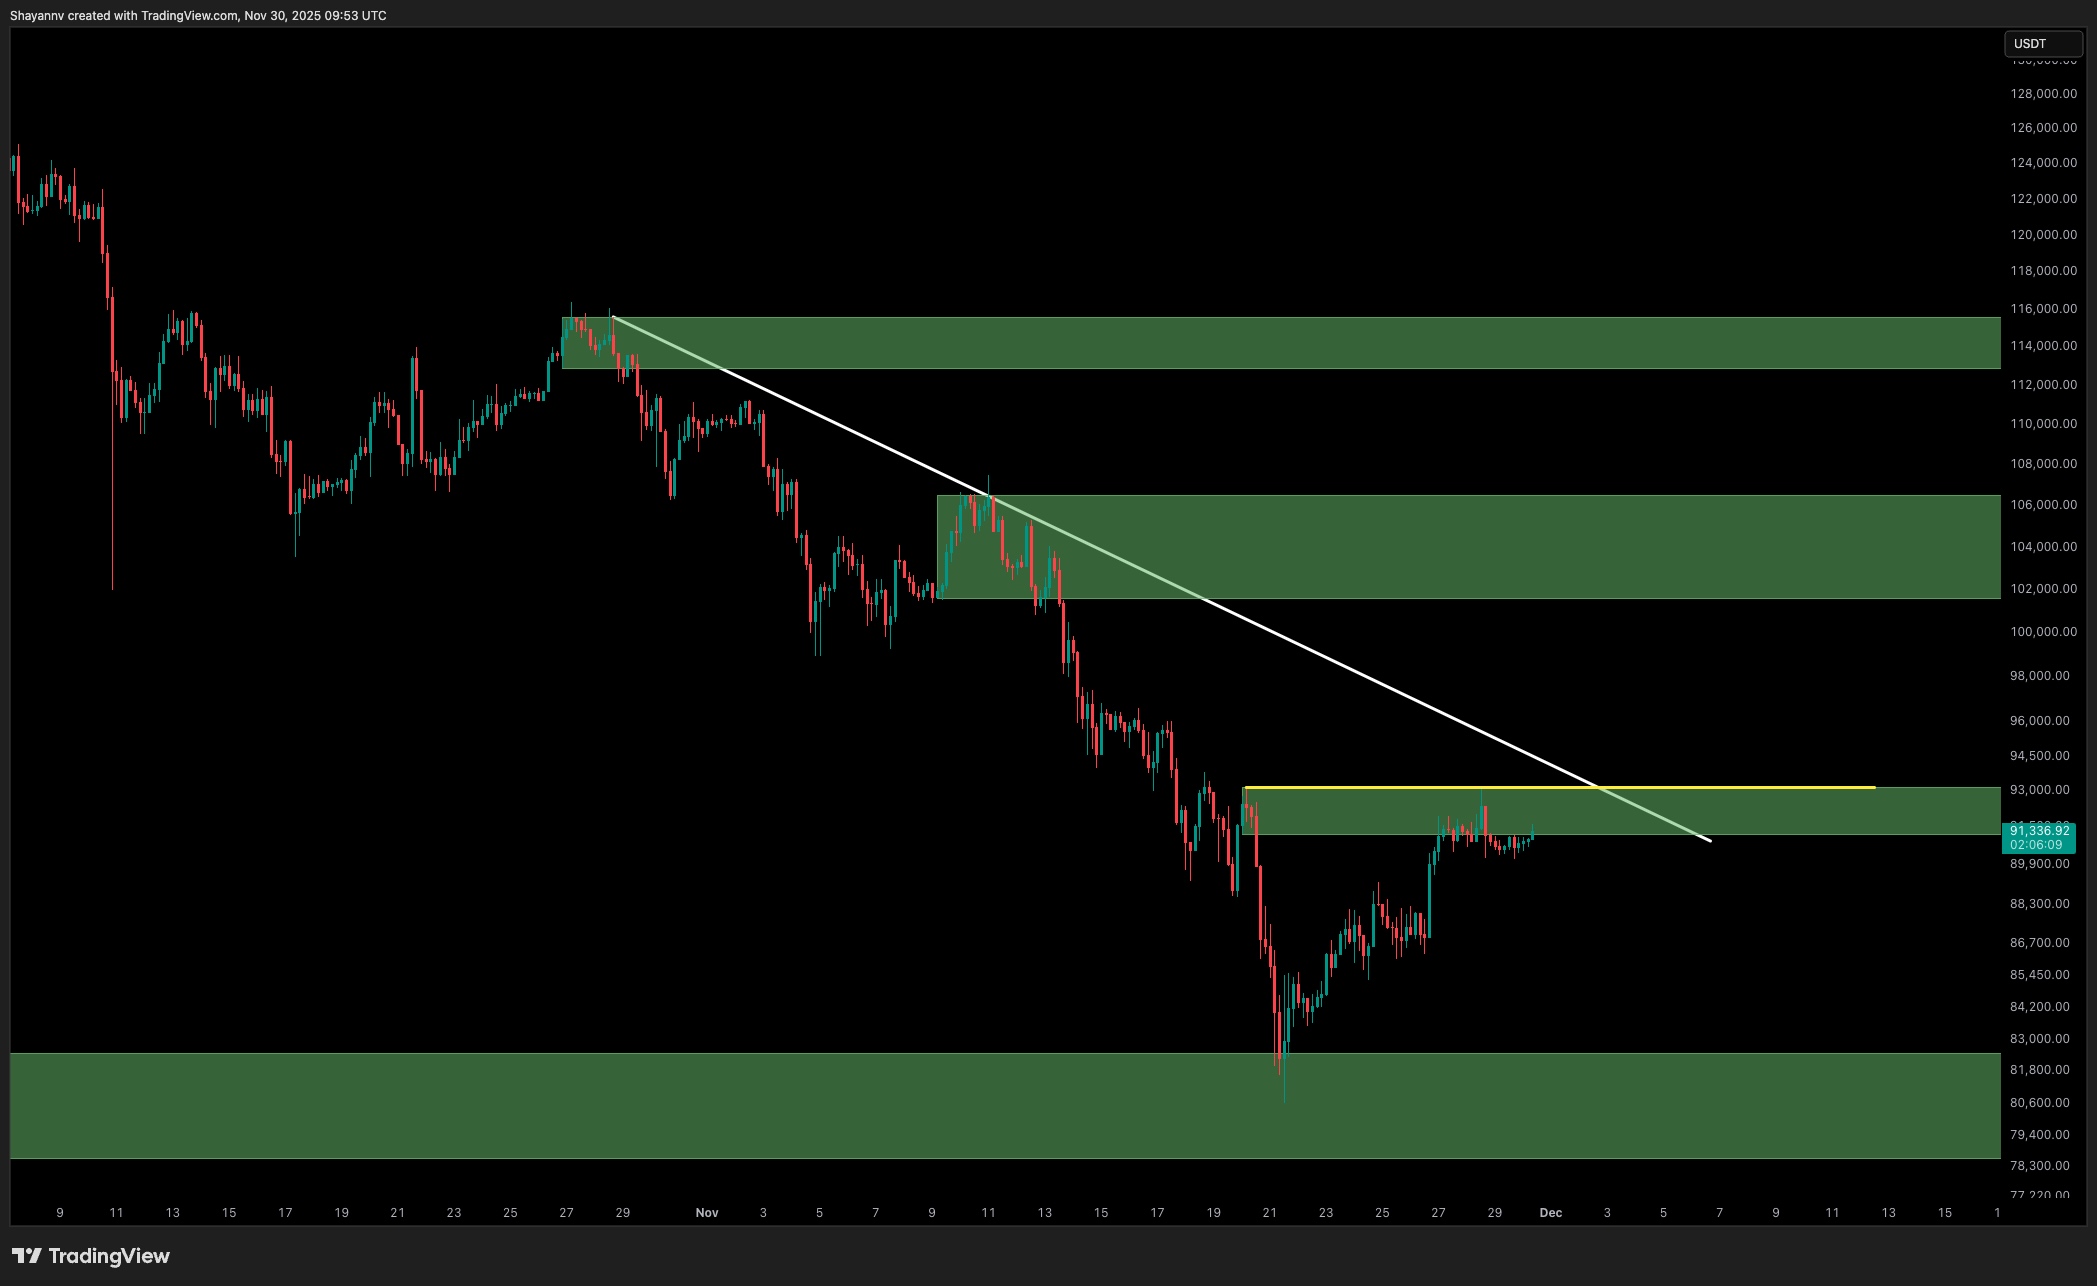
daily chart
Bitcoin remains within a well-defined descending channel, with price currently testing the midrange of this structure. The recent rebound from the $80,000-$83,000 demand zone has been the most aggressive buyback in the last month, but the move has stalled at the lower end of the green supply block around $90,000-$93,000.
The 100-day and 200-day moving averages continue their downward trend and sit above the market, acting as dynamic resistance. As long as prices remain below these MAs, the macro trend will be bearish. The first major invalidation of bearish order flow will only occur if the $103,000 to $106,000 zone, located at the intersection of the larger golden supply area and the previous breakdown structure, is fully recovered.
For now, Bitcoin is struggling to break out of the downtrend line. Each foray into the $91,000-$93,000 area signals weakening momentum, suggesting the market is not yet ready for a sustained breakout.
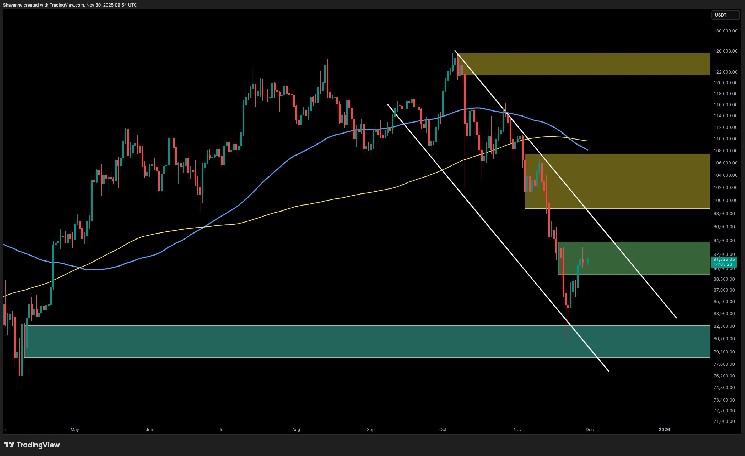
4 hour chart
On the 4-hour chart, the asset has reached a key resistance area marked by a bearish order block range at $92,000 and a multi-week downtrend line. If the current resistance holds, a move back toward $86,000-88,000 is likely, with deeper liquidity still existing in the $80,000-83,000 macro demand zone, which remains the strongest support on the chart.
Conversely, a daily close above the $93,000 level would pave the way to the $102,000-$106,000 inefficiency zone where the next major reaction is expected. The market is currently at a key decision point, and the coming weeks will determine whether this pullback develops into a full-fledged retracement or fades into a continuation of the broader downtrend.
On-chain analysis
Written by Shayan
While technical indicators highlight the $92,000 level as an immediate hurdle, on-chain data reveals a formidable “second tier” of resistance just above, depending on the average cost base of certain market participants.
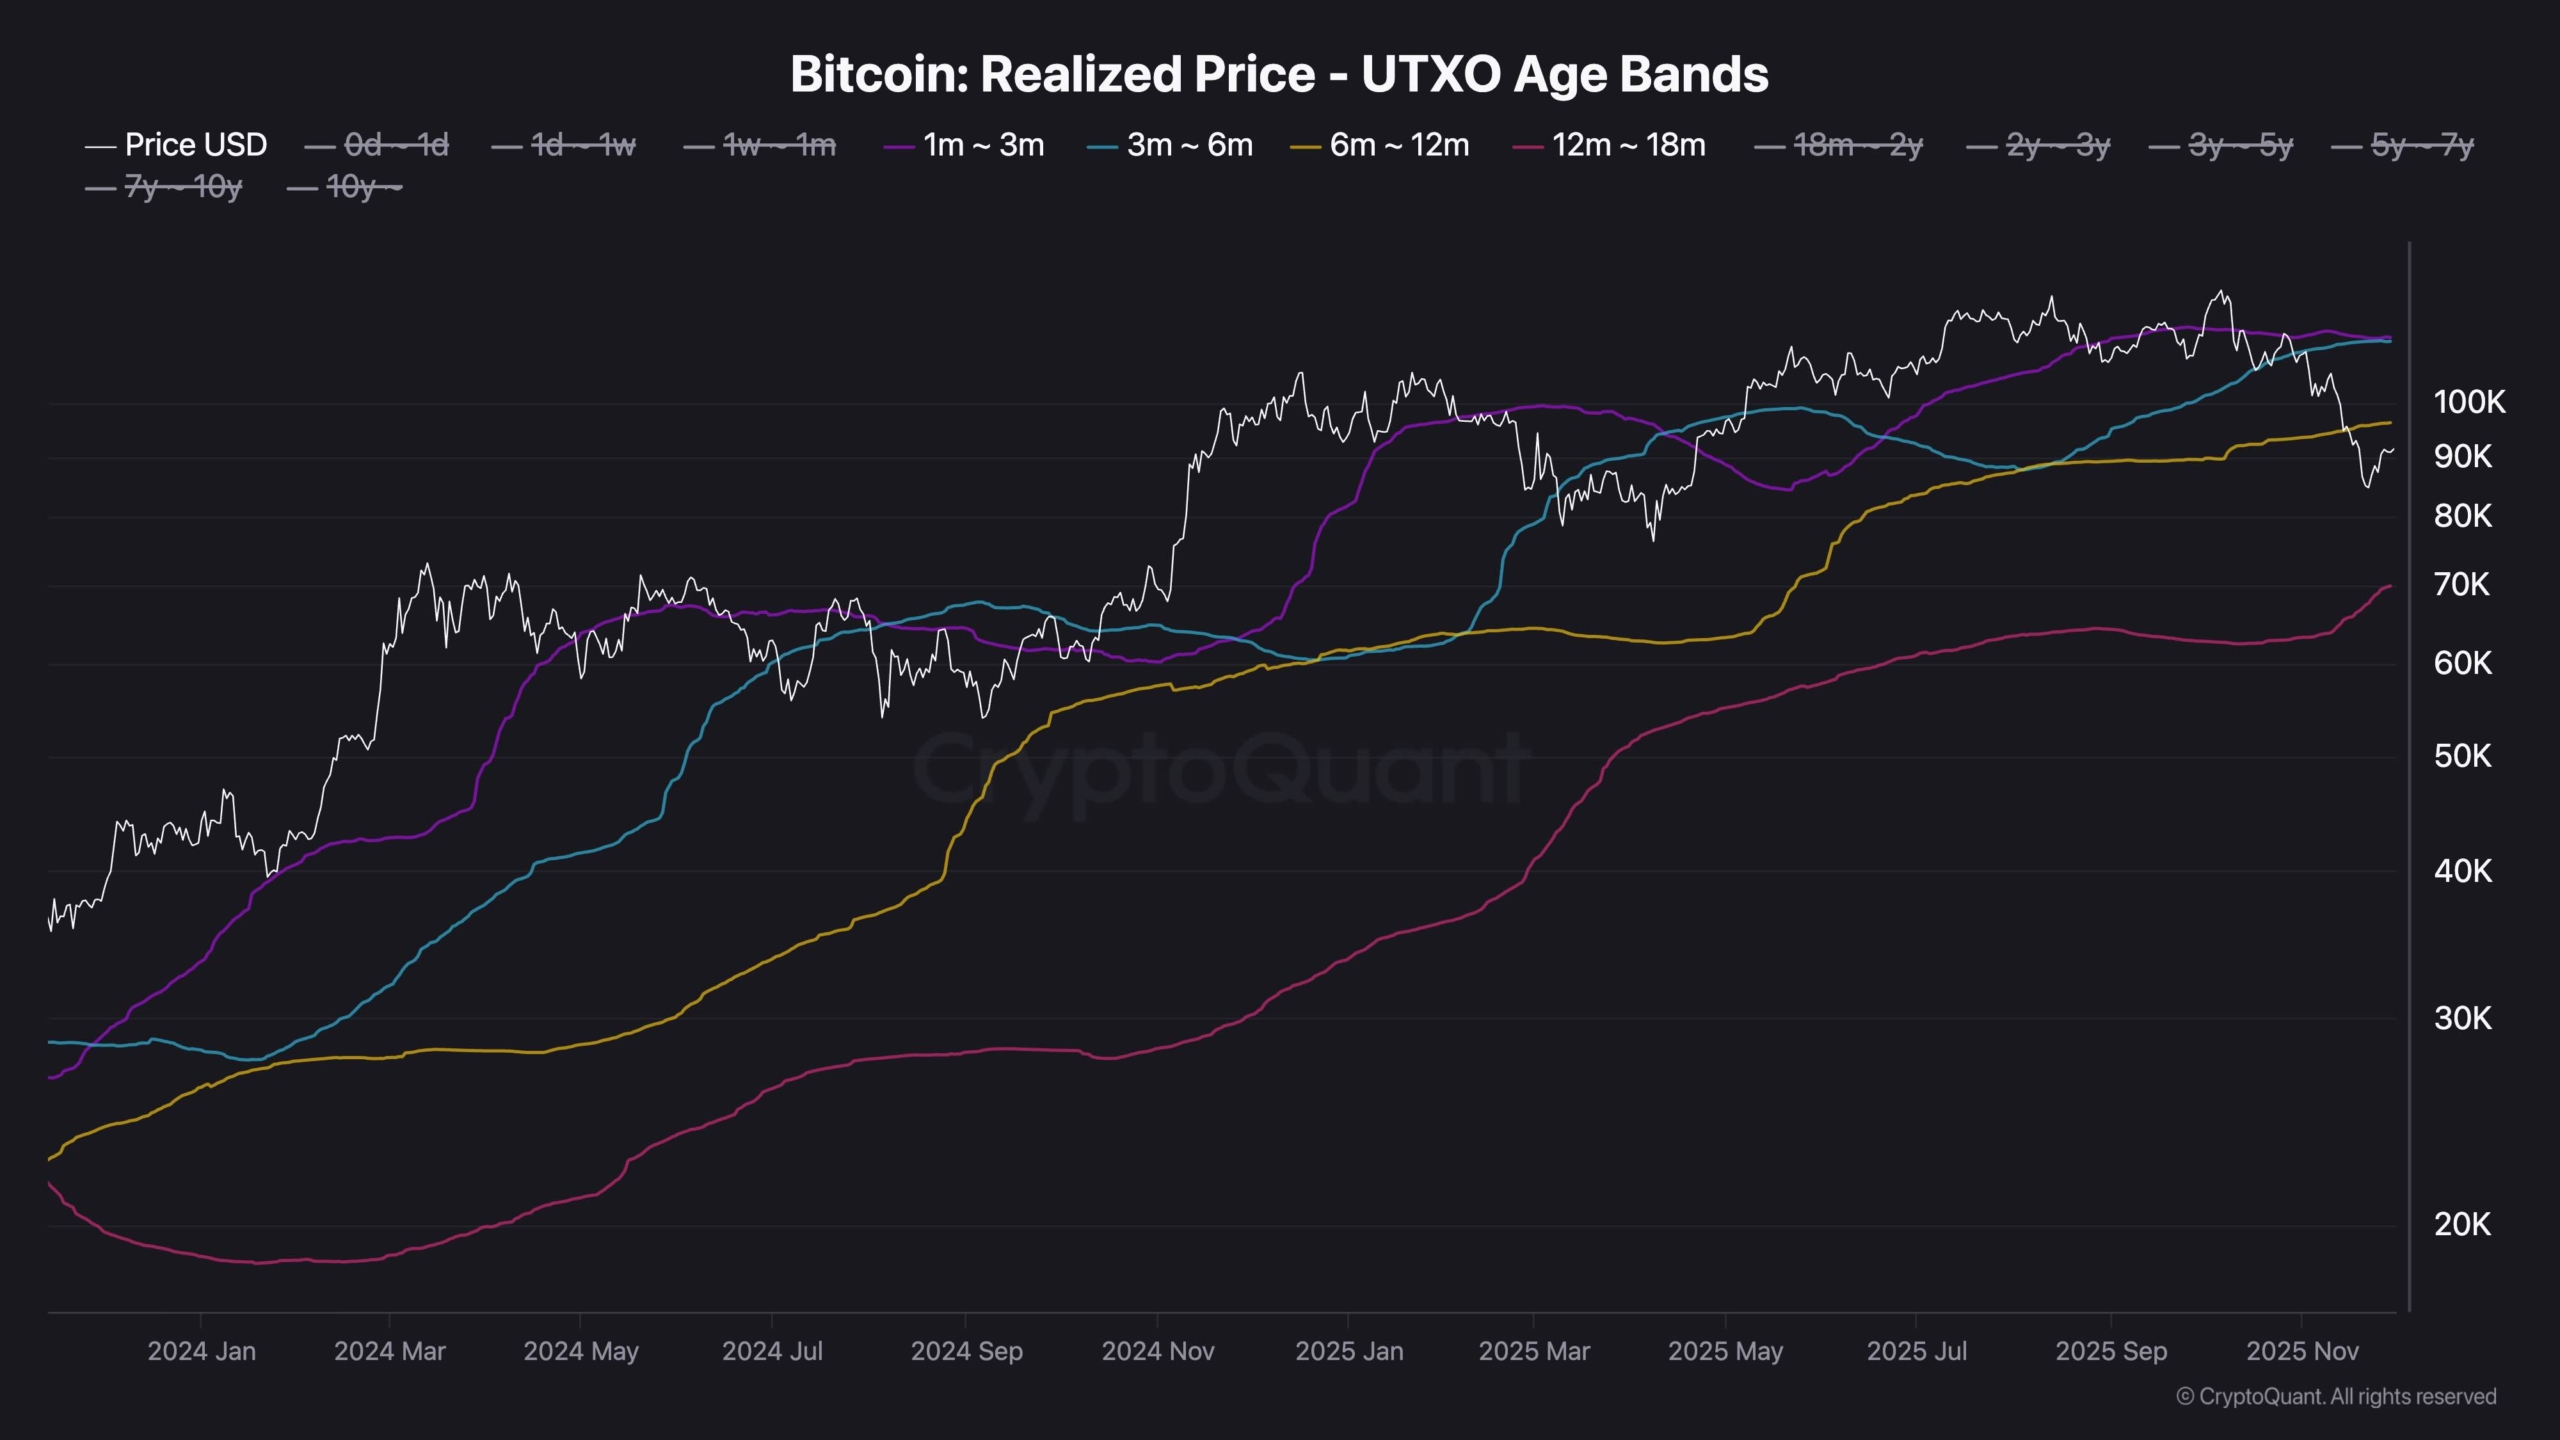
Realized price metrics by UTXO age bands are essential for identifying support and resistance, as realized prices for a given cohort often act as a psychological barrier. If the spot price trades below these levels, these holders will be in a position of unrealized losses. As a result, once prices return to their average cost basis, these investors often aim to exit at breakeven, creating significant sell-side pressure.
The graph now highlights an important confluence of two distinct cohorts.
1 week to 1 month cohort (green line): Represents recent “fomo” buyers or buyers who caught a falling knife.
6-12 month cohort (orange line): represents medium-term holders who entered at the beginning of the year.
The realized prices for both of these cohorts roughly converge in the $96,000 to $97,000 range.
This confluence acts as a huge resistance block. Even if Bitcoin manages to clear the technical resistance at $92,000, the rally will likely face depletion around $96,000-$97,000 as these important groups look to cut losses and exit the market.
The overlap of these two age groups amplifies resistance through a combination of short-term traders’ panic and intermediate-term investors’ capitulation. A definitive close above $97,000 is needed for the market to absorb this selling pressure and signal that it is ready for a higher valuation.