
Bitcoin is trading at $70,426 per unit as of March 10, 2026, after rebounding from an intraday low of $67,958 and briefly testing a session high of $71,220. As the price trend stabilized within a well-defined intraday range, the market capitalization of cryptocurrencies reached $1.408 trillion, with a 24-hour trading volume of $54.48 billion.
Bitcoin chart outlook
Price action across the daily chart reflects the market’s transition from the sharp downside volatility earlier in the broader cycle to a period of range-bound consolidation. session rThe $67,958 to $71,220 range highlights sustained dual-sided activity with participants repeatedly testing the upper end while defending the lower support area.
The recovery from the session lows suggests that buyers remain active near the lower end of the range, despite failing to firmly establish territory above $71,000.Kett’s consolidation stance rather than suggesting a definitive directional breakout.
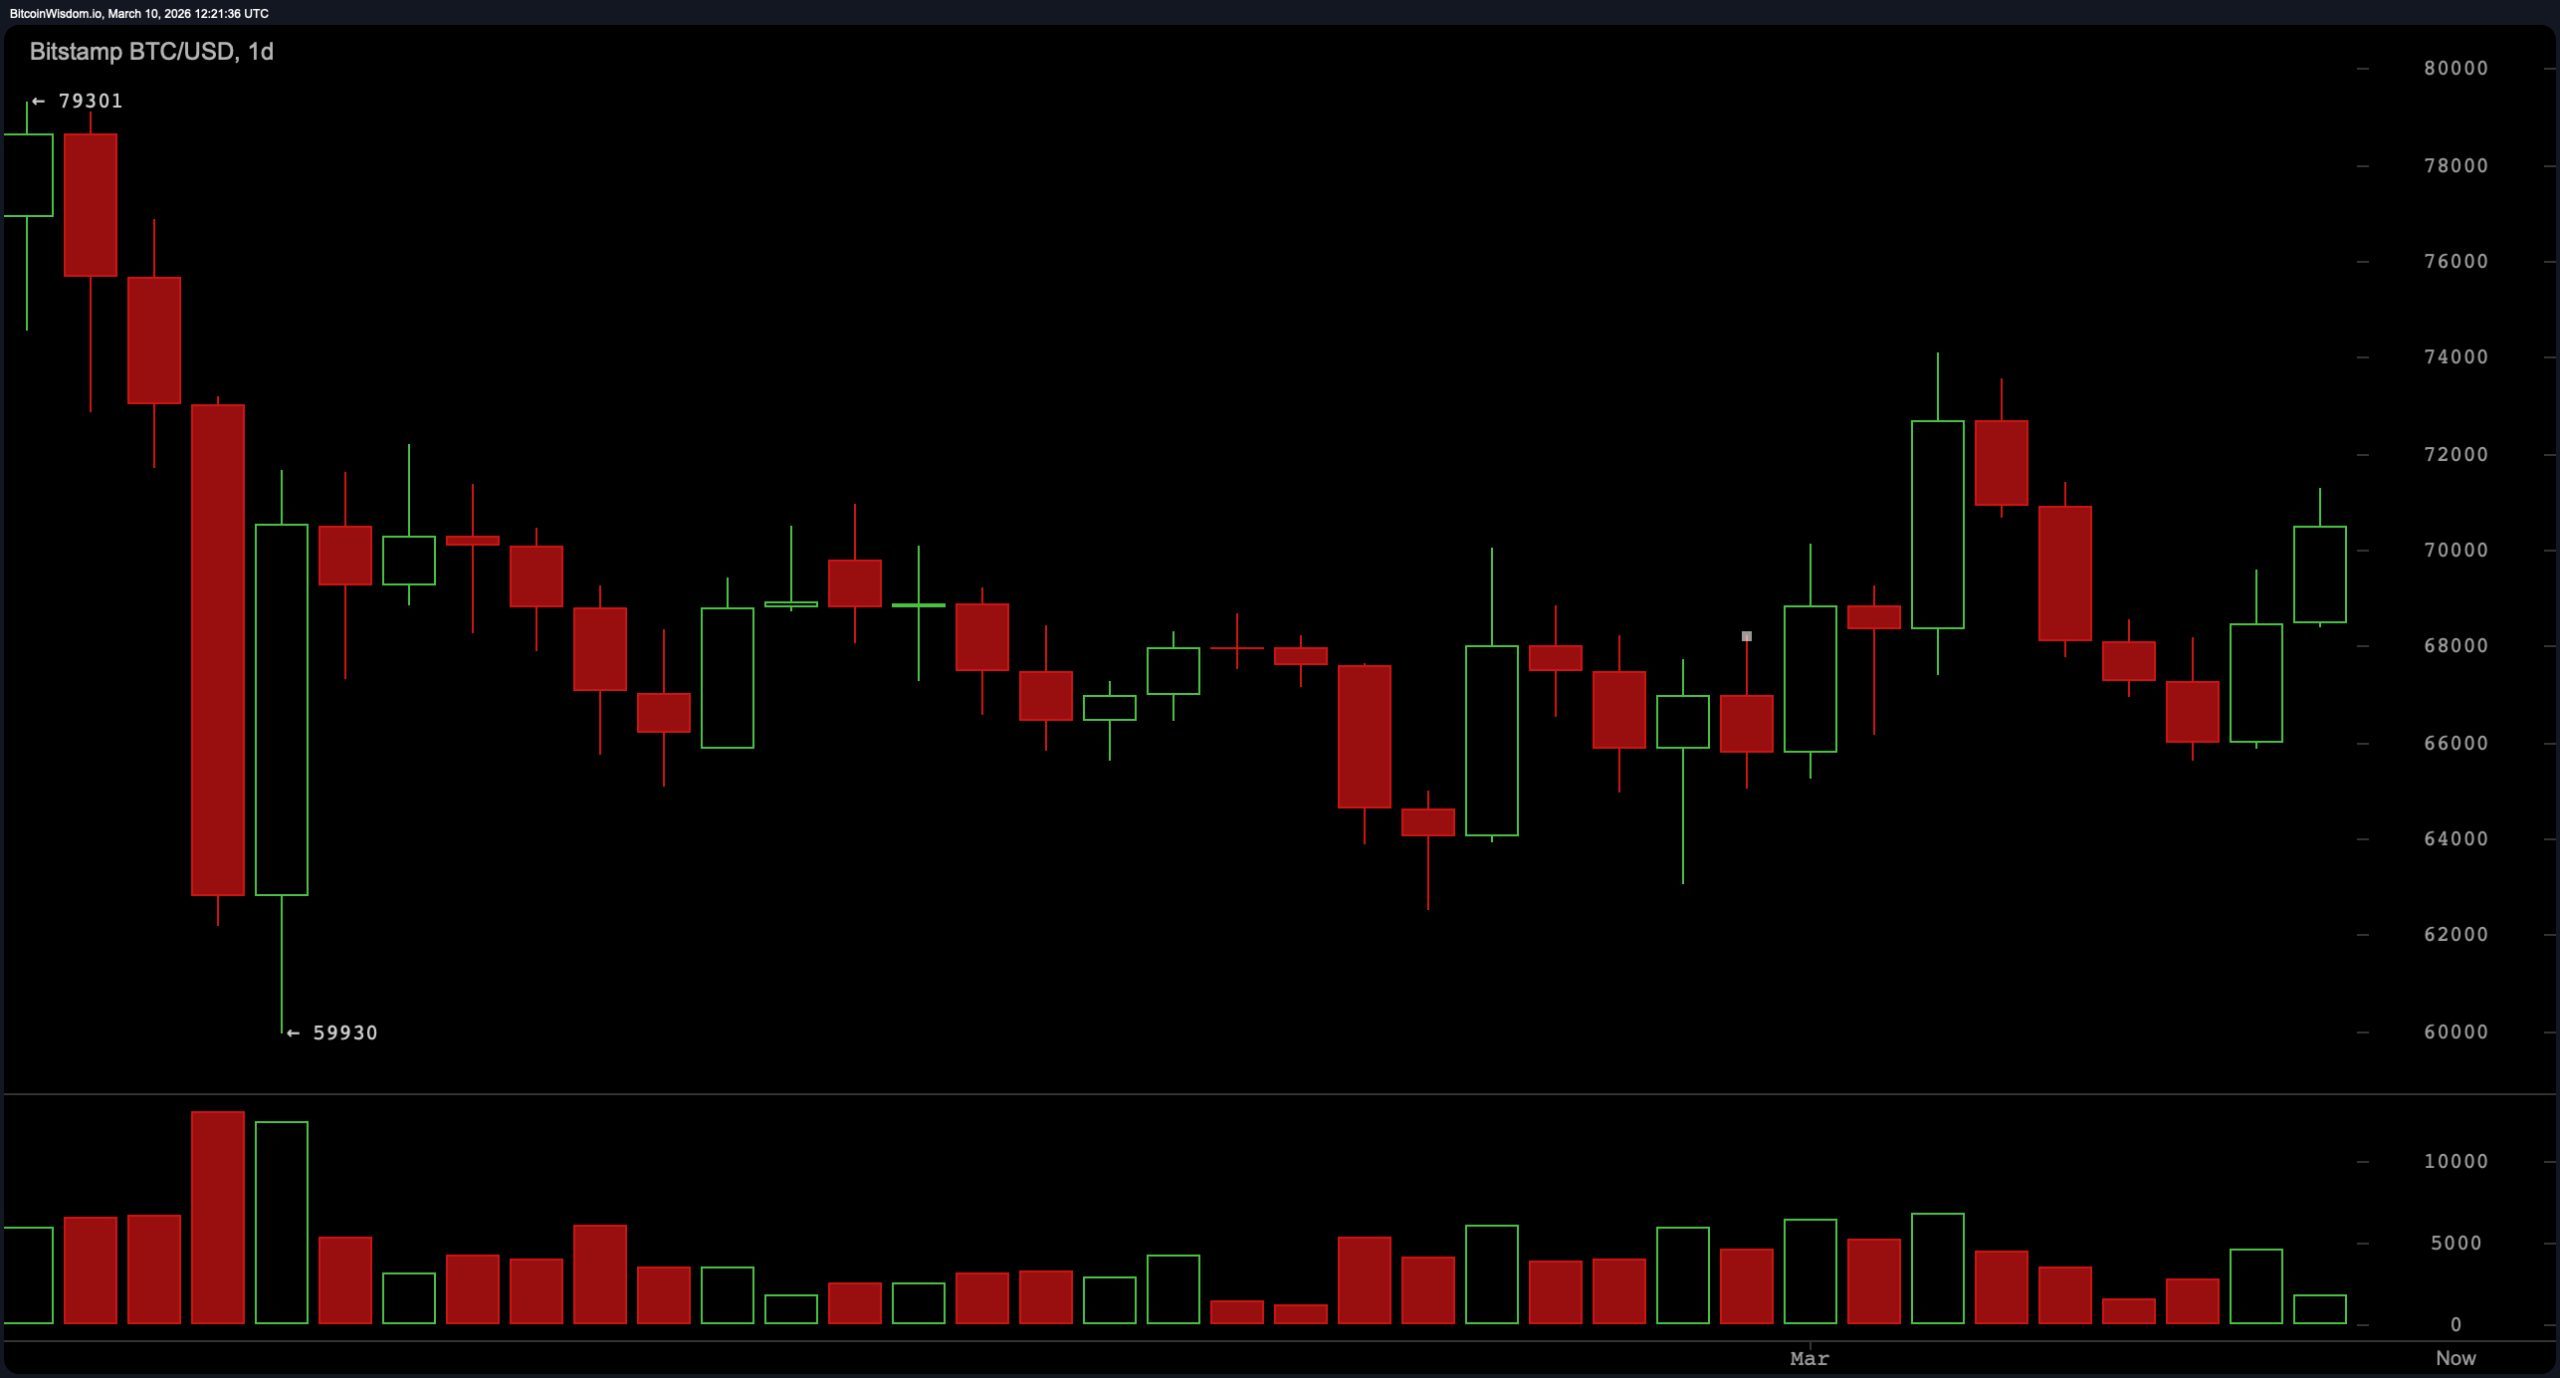
$BTC/USD 1-day chart via Bitstamp on March 10, 2026.
The 4-hour chart more clearly shows the recovery structure that has developed after the recent downside move towards the mid-$60,000 area. The price movement has formed a series of lows, gradually pushing Bitcoin towards the top of its current range. The advance towards the $71,000 area coincides with a visible supply zone where previous attempts to move higher have lost momentum. While the upward staircase pattern indicates strengthening short-term structure, this approach to the resistance band suggests that the market is currently testing whether there is enough participation in the recovery to challenge the ceiling again.
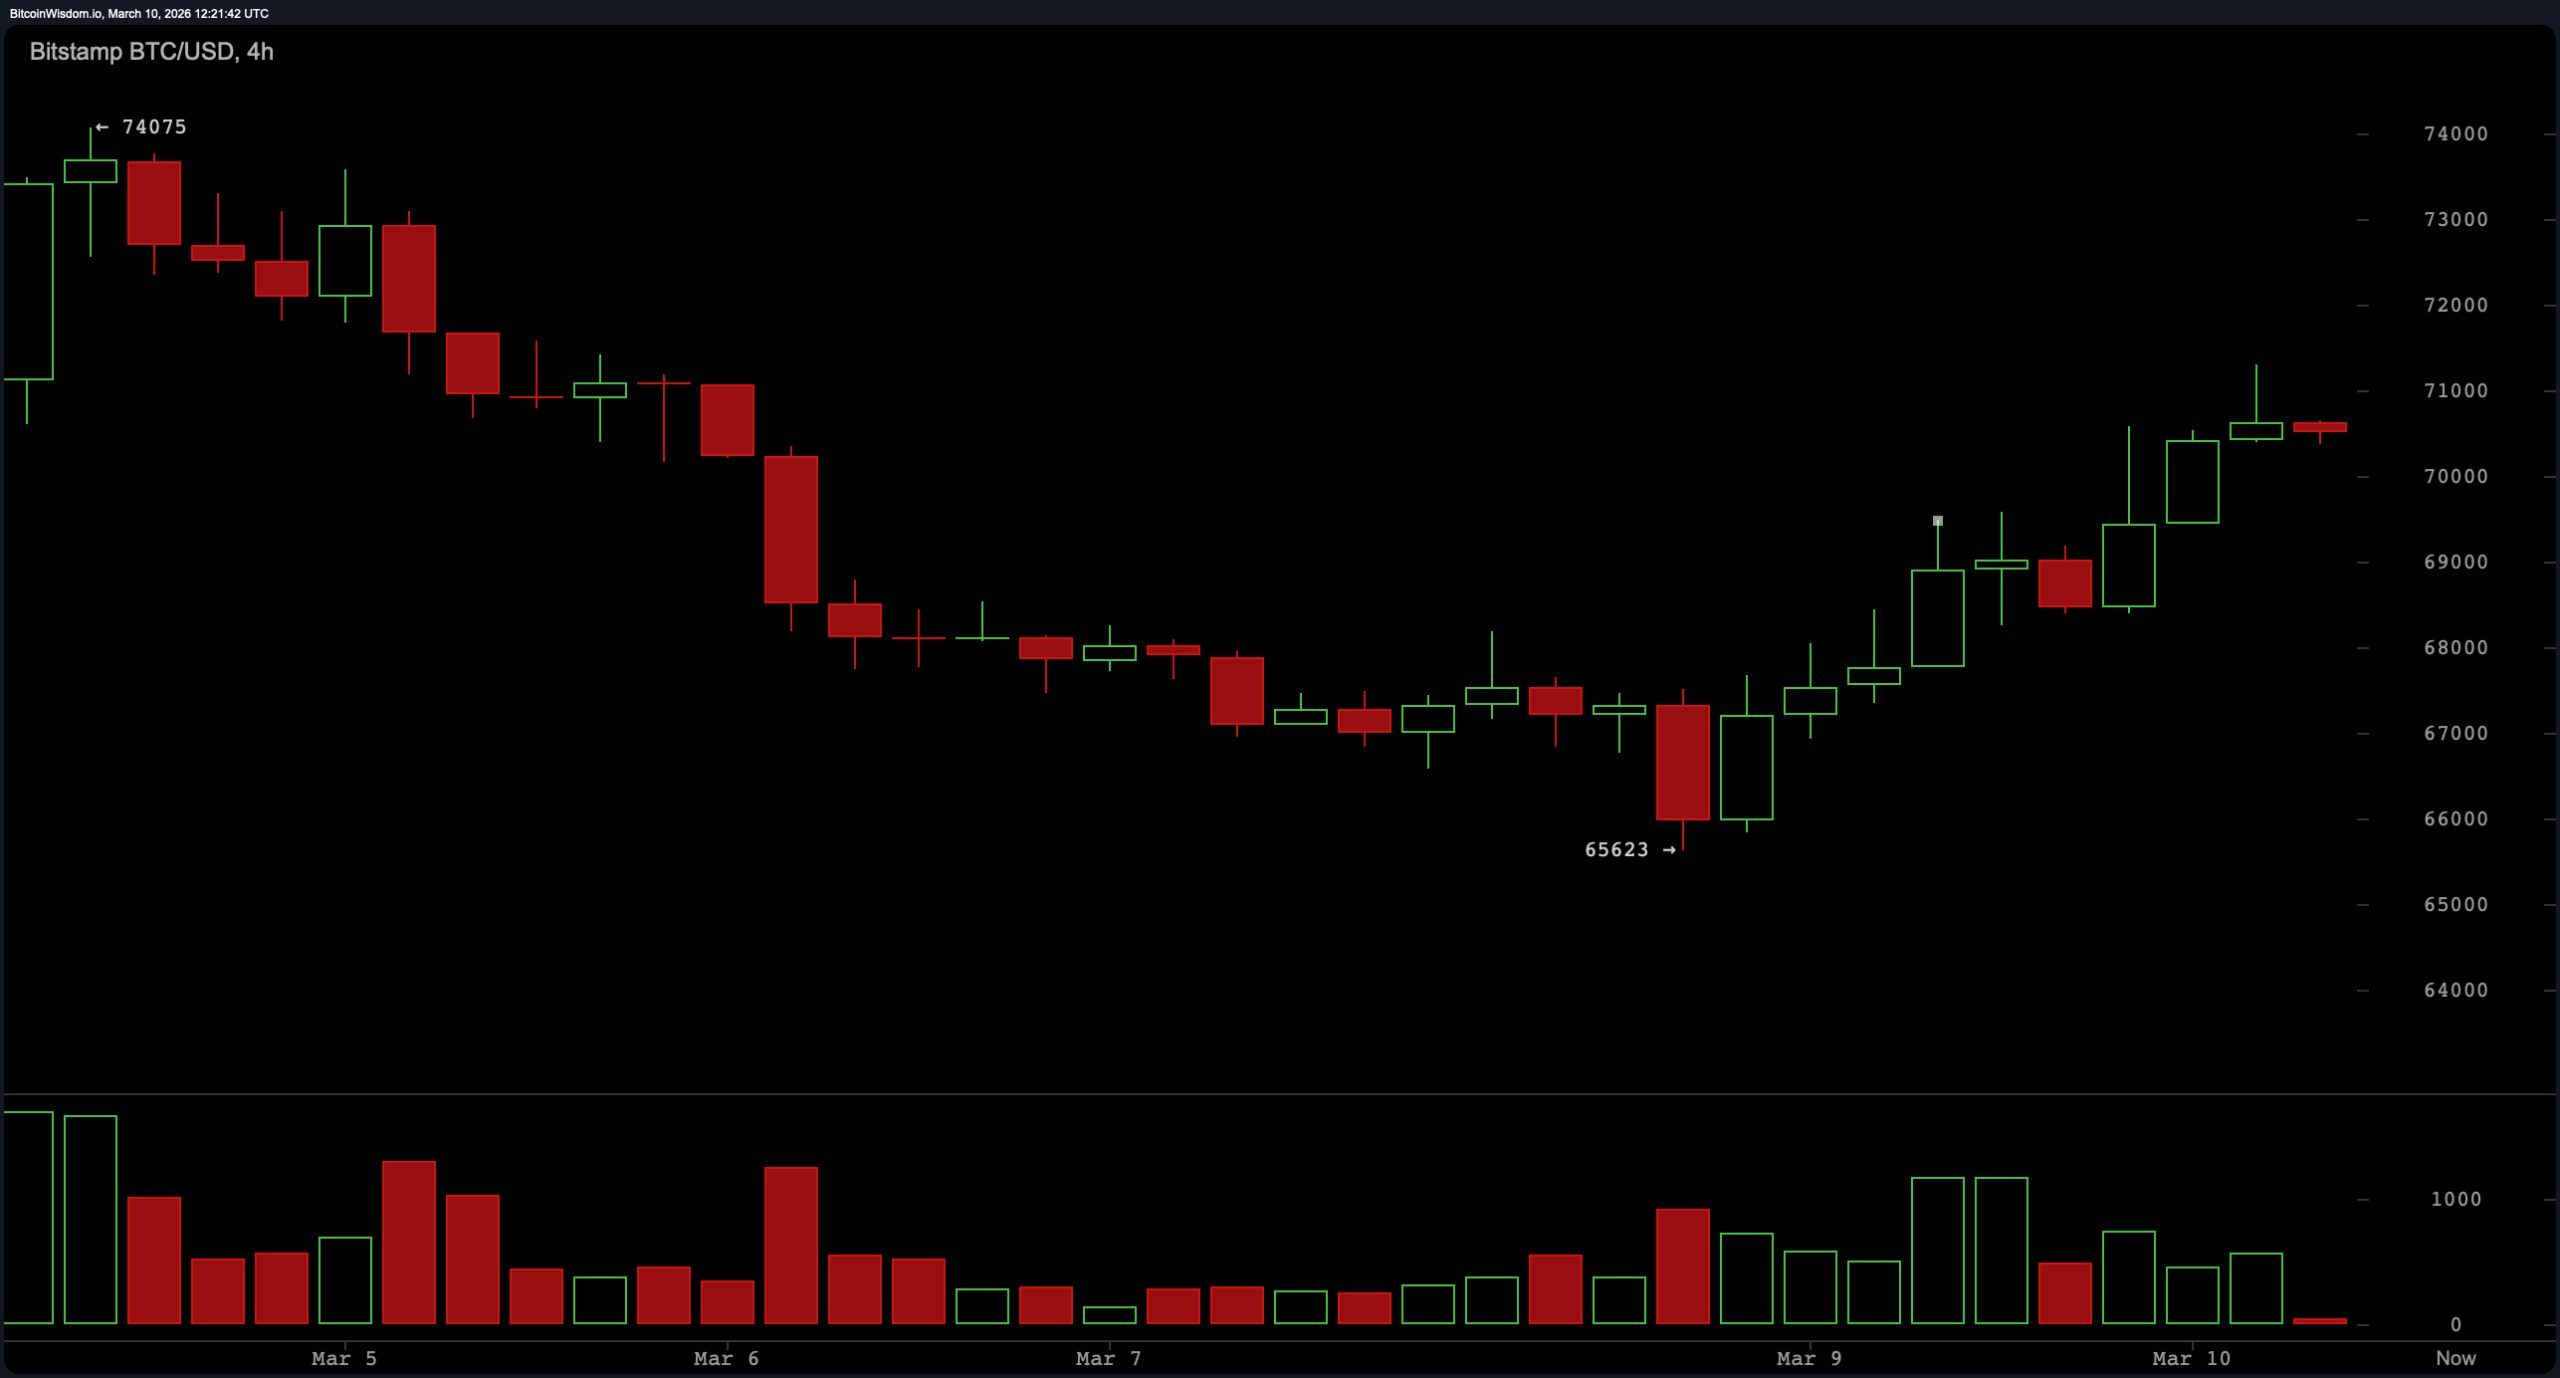
$BTC/USD 4-hour chart via Bitstamp on March 10, 2026.
On the hourly chart, the rally from the intraday low to the $71,220 high shows that the price is stuck near resistance, indicating that momentum is starting to slow. Candlesticks following a local high display have reduced follow-through, indicating a cooling phase rather than a rapid, sustained movement. It remains clear that liquidity is still being tested around $70,000, with the market trading above near-term structural support areas around $68,500 to $69,000. So Larry is running up the hill, reaching the fence, and deciding whether to jump or just stare at it for a while.
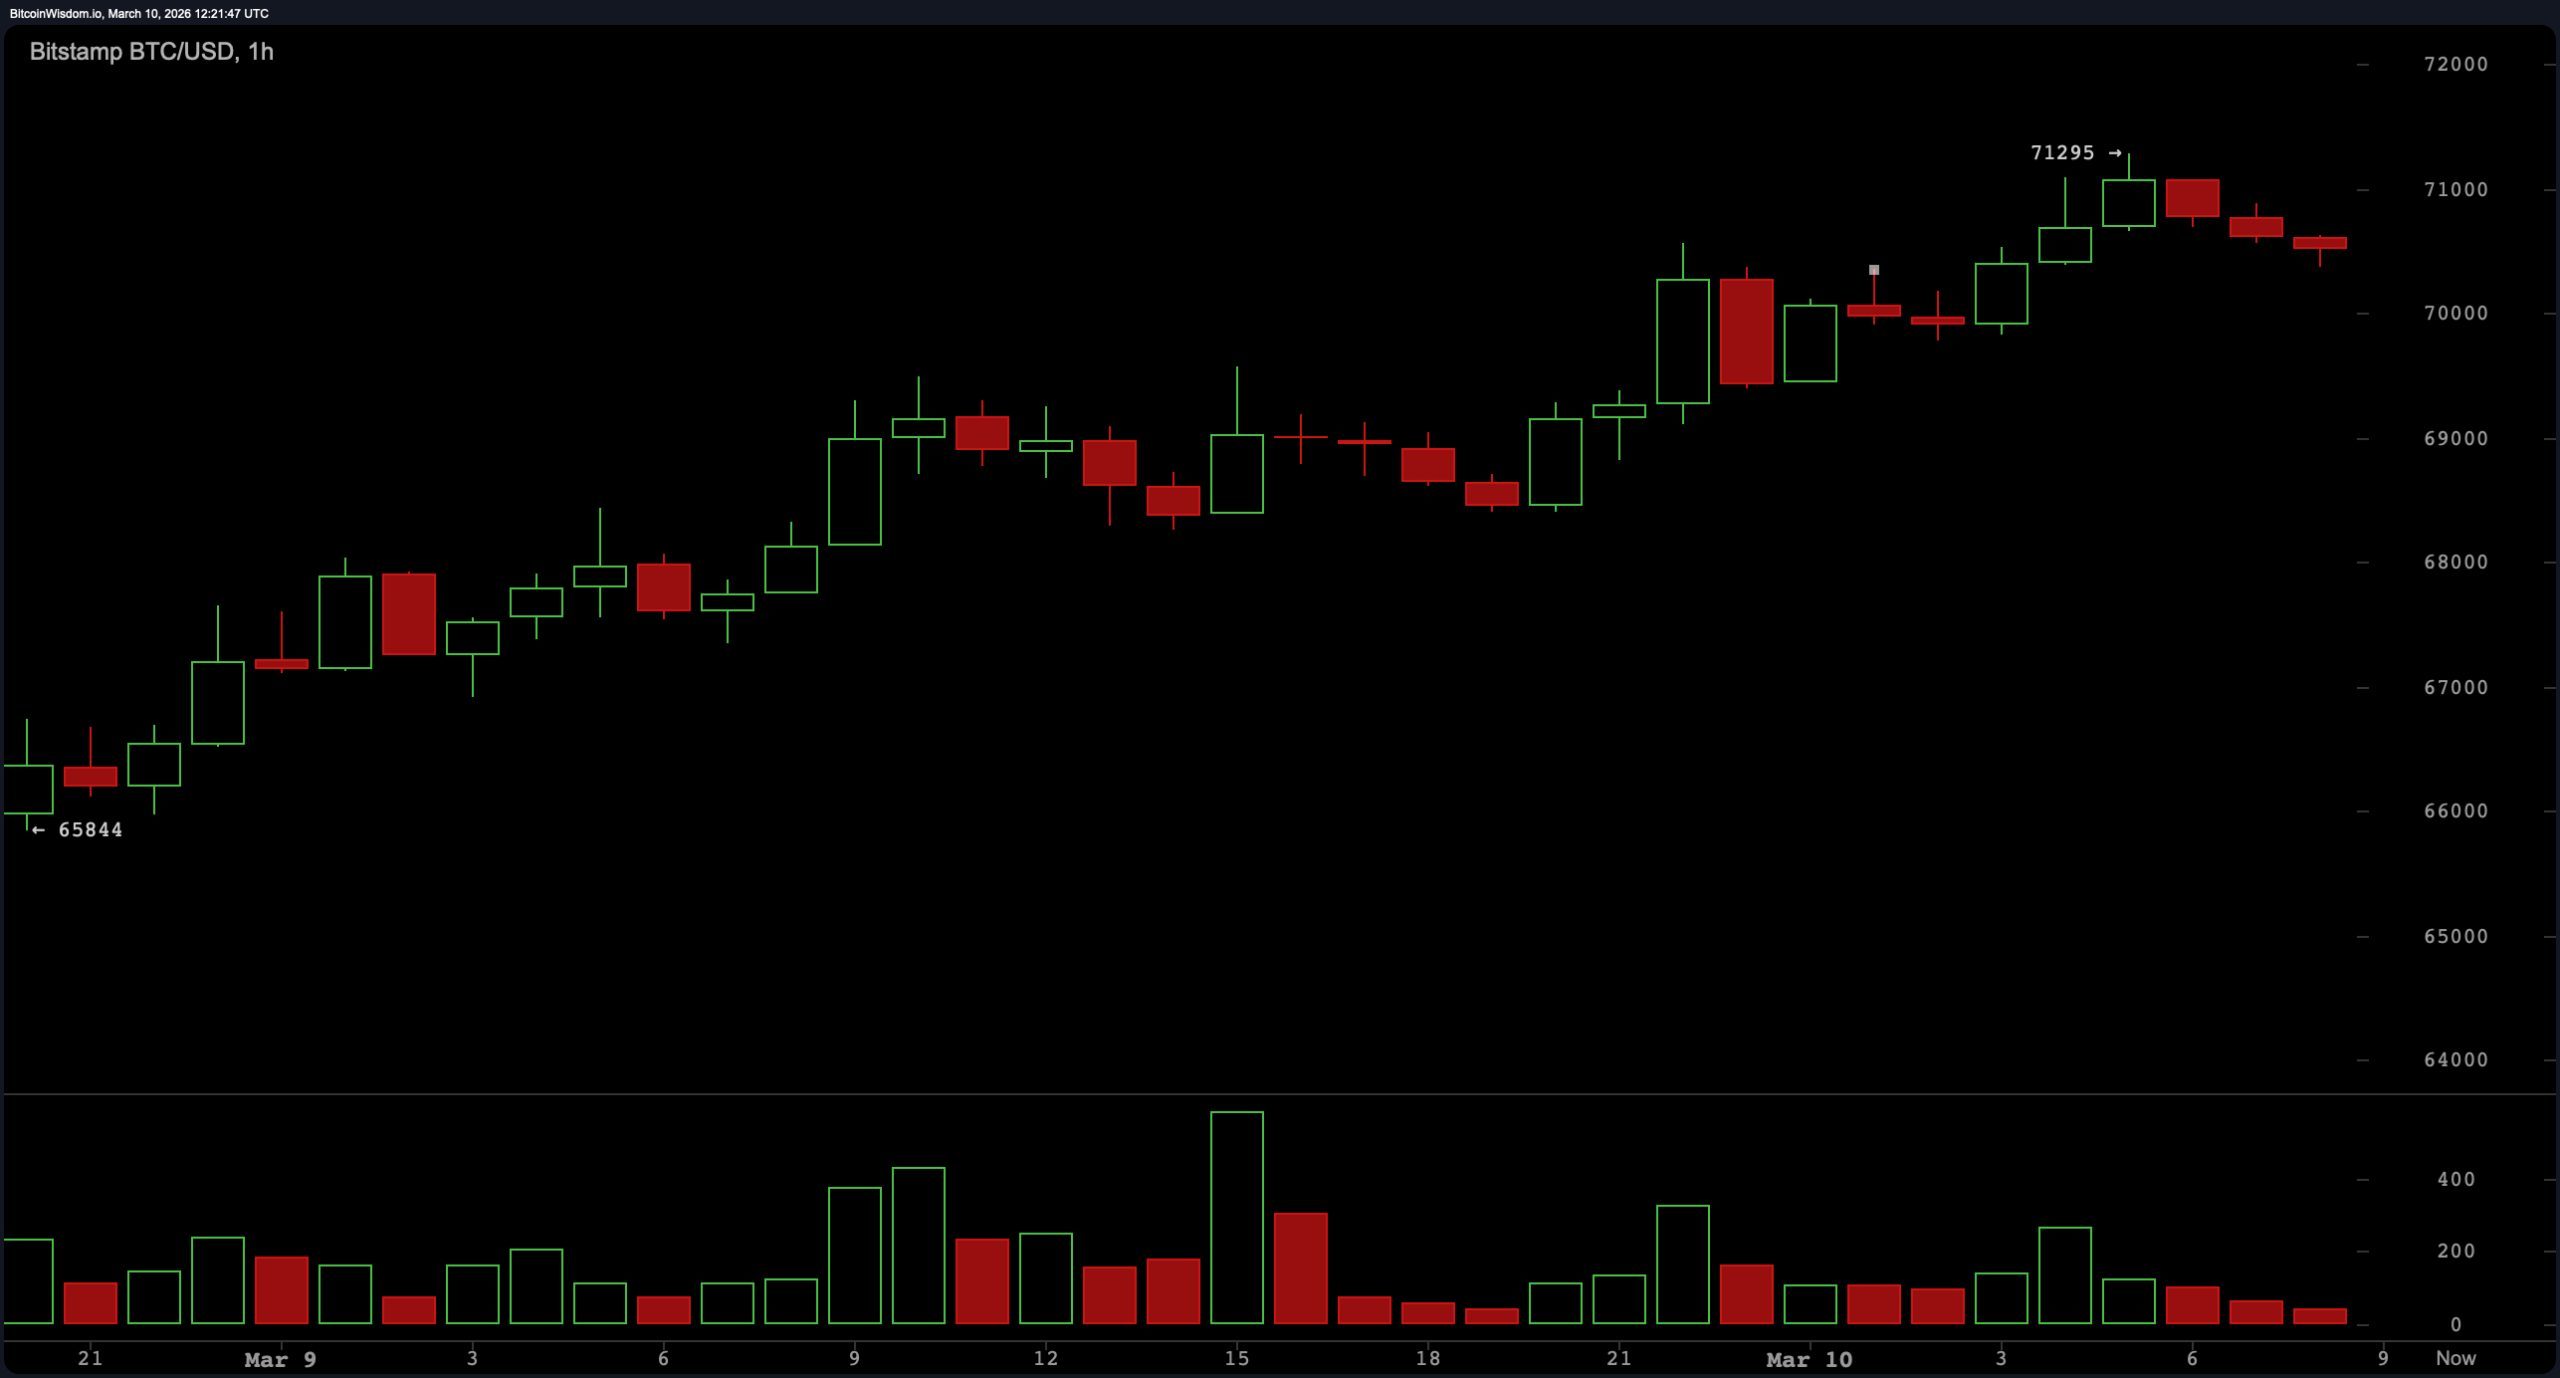
$BTC/USD 1-hour chart via Bitstamp on March 10, 2026.
Oscillator readings from TradingView reinforce the market’s broad neutral stance. The Relative Strength Index (RSI) is 52, while the Stochastic shows 50, both indicating a state of balanced momentum rather than an environment of excess. The Commodity Channel Index (CCI) was recorded at 125 and the Average Directionality Index (ADX) was recorded at 31, reflecting a moderate trend.We were unable to establish a definitive direction.
Awesome Oscillator on Tuesday recorded 433, Momentum is at 3,628 and Moving Average Convergence Divergence (MACD) level is at -906. Overall, the oscillator shows two signals supporting upward momentum and nine neutral readings, suggesting moderate positive pressure but not an overwhelming increase in confidence.
Moving averages give a more granular view of the technical situation, depending on the sensitivity of the timeframe. Short-term indicators are trending positively, with the exponential moving average (10) at $68,517 and the simple moving average (10) at $68,694, both below the current price. The EMA (20) of $68,711 and SMA (20) of $67,725 are also below the market, along with the EMA (30) of $69,919 and SMA (30) of $67,894.
However, long-term trend gauges are still overhead, including EMA (50) at $73,162, SMA (50) at $73,201, EMA (100) at $80,432, SMA (100) at $81,749, EMA (200) at $88,693, and SMA (200) at $94,970. The result is a technical situation where short-term averages support the current recovery, while long-term averages stand in the way like skeptical regulators.Even if this rally can maintain its momentum.
Bullish verdict:
If Bitcoin continues to hold above the $69,000 structural support area highlighted on the lower timeframe, the technical bias favors another test of the resistance between $71,000 and $71,200. Continued strength above this band indicates growing momentum within the current range structure and could open the door for a move towards the upper end of a broader consolidation zone around $72,000 to $74,000 if volume and short-term momentum indicators continue to align.
Bear verdict:
Failure to sustain support above the $69,000 area could weaken the current recovery structure and bring attention back to the $67,500-$68,000 support zone identified on the 4-hour chart. A further decline towards the $66,000 to $64,000 demand area would send Bitcoin back towards the lower end of the broader consolidation range where market participants have been intervening to stabilize the price.
Frequently asked questions 🔎
- What is the price of Bitcoin on March 10, 2026?
Bitcoin is trading near $70,426, rebounding from a 24-hour low of $67,958.93 and approaching resistance near $71,200. - Is Bitcoin trending up now?
Although the short-term chart shows higher lows and a recovery, the broader structure remains within the approximately $64,000 to $72,000 range. - What are the key Bitcoin resistance levels today?
Immediate resistance lies between $71,000 and $71,200, with stronger range resistance forming around $72,000 and $74,000. - What are the main Bitcoin support levels to watch?
The major support zones are around $69,000, $67,500-$68,000, and the major demand zone is around $64,000-65,000.