Bitcoin has regained momentum since breaking above the $70,000 level, a move that has helped restore some bullish sentiment after weeks of heightened volatility. This recovery follows a period of turmoil in global markets, where geopolitical developments and macro uncertainties caused price fluctuations across risk assets.
According to a recent report on CryptoQuant by XWIN Research Japan, Bitcoin experienced significant volatility from late January to early March 2026. During this period, Bitcoin briefly fell to the mid-$60,000 range, but rebounded sharply in early March, bringing the price back to around $73,000.
The report notes that the initial decline was mainly caused by geopolitical developments. On February 28, reports of a military attack on Iran by the United States and Israel increased tensions across the Middle East and created significant uncertainty in global markets. Bitcoin rapidly fell to around $63,000 on February 29 as risk sentiment worsened.
However, it turned out that the decline did not last long. Market conditions stabilized within a few days, and by March 2, Bitcoin had already recovered to a level of around $70,000.
Momentum quickly picked up thereafter as renewed buying pressure took BTC above $73,000 between March 4 and March 5, signaling a potential shift in near-term sentiment as investors reassess the broader market environment.
ETF inflows and short covering accelerate Bitcoin rebound
The CryptoQuant report further explains that new inflows into the US Spot Bitcoin ETF played a major role in driving the recent rally. In early March, hundreds of millions of dollars flowed into these investment vehicles, directly supporting spot market demand. On March 4 alone, ETF inflows exceeded $200 million, highlighting a resurgence in institutional investor participation after a period of low activity.
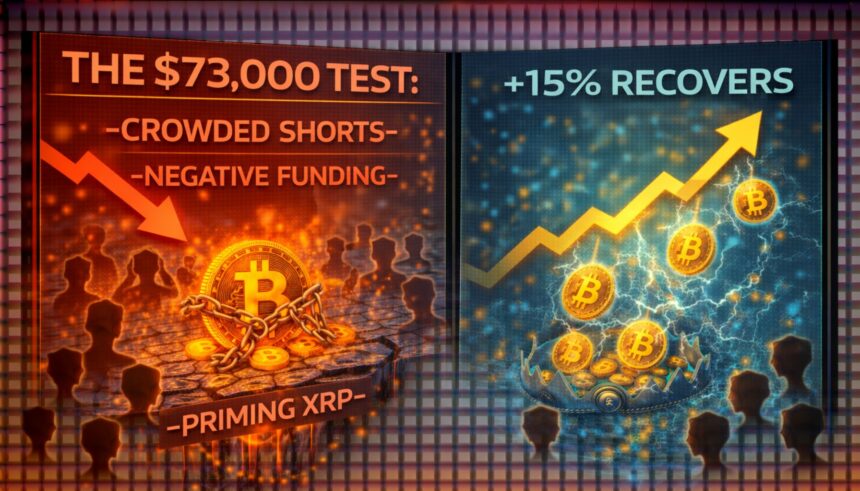
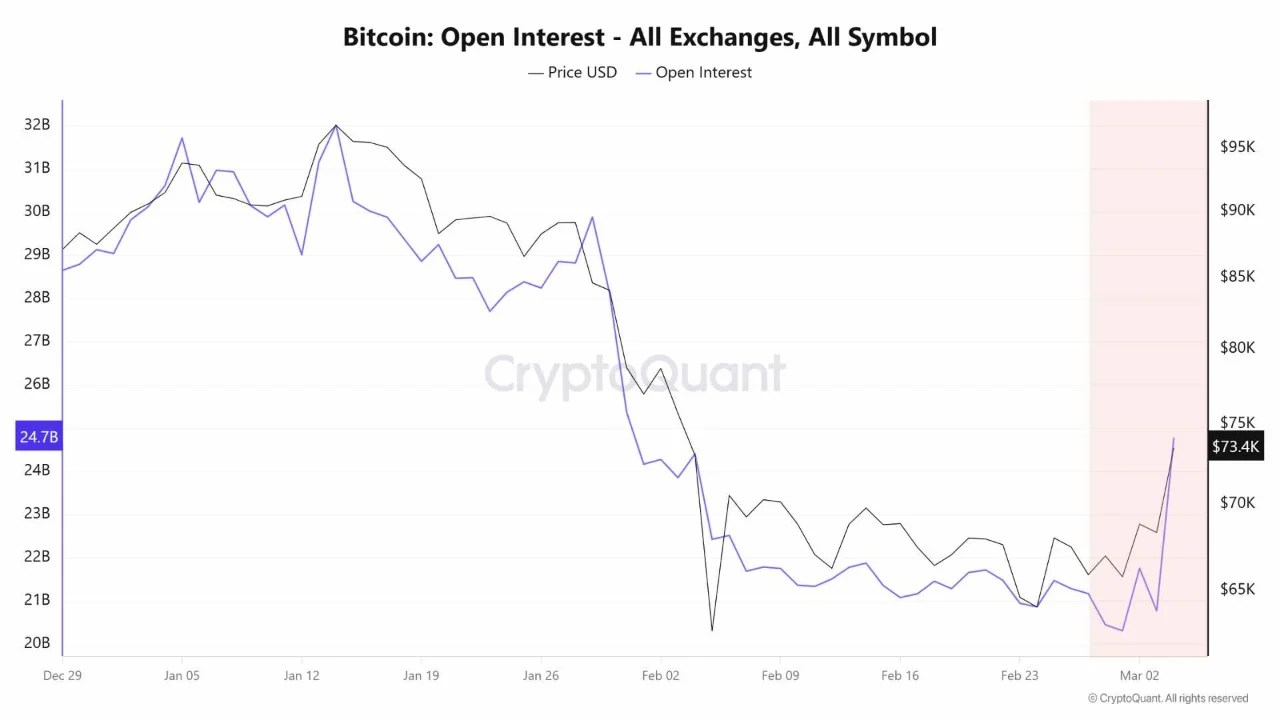
Derivatives markets also contributed significantly to the rise. Open interest increased sharply as funding rates moved into negative territory, indicating that many traders were actively taking positions on the short side. As Bitcoin’s price began to rise, these crowded short positions were forced to unwind, triggering a wave of short liquidations and amplifying the upward momentum through short covering.
On-chain indicators provide a more nuanced picture. The report notes that bearish signals still remain, such as the 90-day realized profit/loss ratio remaining below 1.0 and the increasing proportion of coins currently carrying unrealized losses. At the same time, constructive developments are emerging behind the scenes.
An example is the Coinbase Premium Index. The Coinbase Premium Index recently returned to positive territory after an extended period of negative readings. This change suggests that demand from US-based investors is starting to recover.
The move towards $73,000 appears to be primarily driven by a combination of ETF inflows and derivative short covering.
Momentum gains strength as Bitcoin breaks through major resistance levels
The chart shows Bitcoin trading around $73,100 after a strong rally that pushed the price decisively above the $70,000 level. This breakout came after several weeks of consolidation between approximately $64,000 and $69,000, where the market repeatedly tested both support and resistance without establishing a clear direction.
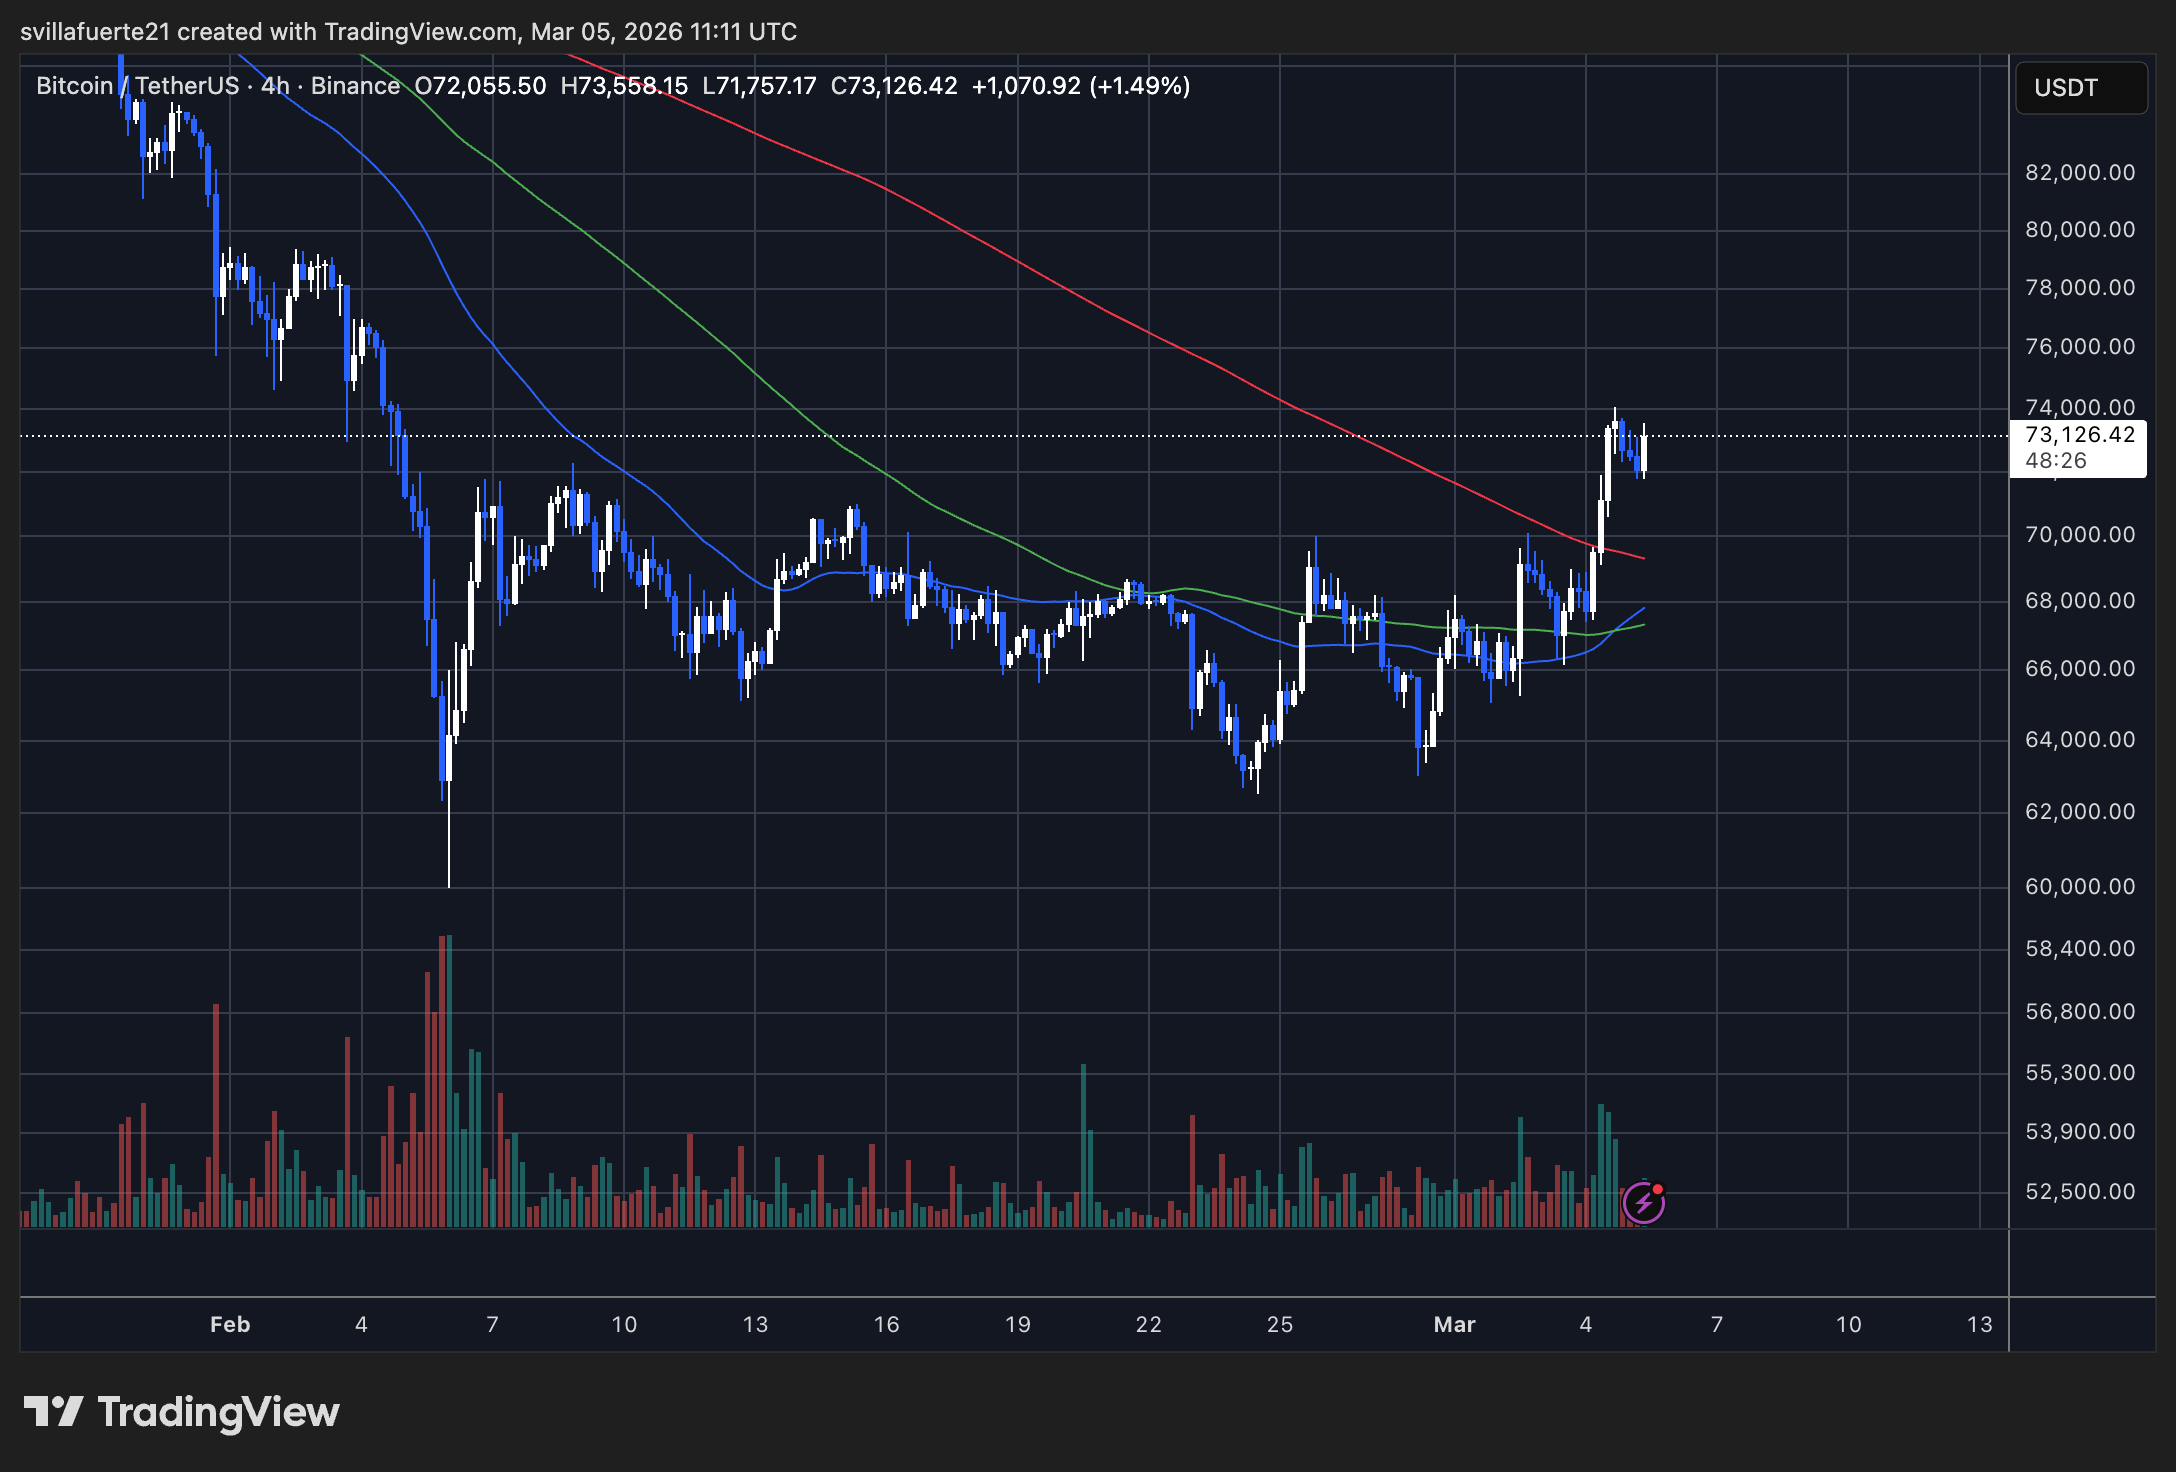
From a technical perspective, the recent rally has allowed Bitcoin to regain its short-term moving averages, including the 50-period and 100-period lines that previously served as resistance during the consolidation phase. A breakout of these levels suggests a shift in near-term momentum as buyers regain control of the market.
Price is now approaching the 200-period moving average, which is slightly above current levels and poses a key technical barrier around $74,000. This level could act as the next resistance zone, as long-term participants often use this level as a trend confirmation criterion.
Volume also increased during the breakout, indicating increased participant participation as the market moved higher. The spike in candlesticks reflects aggressive buying pressure and is consistent with the short covering behavior observed in the derivatives market.
If Bitcoin manages to consolidate above $70,000, a breakout could establish this level as a new support zone. However, failure to sustain this structure could result in the market retesting the $68,000-$69,000 area before attempting a move in a new direction.
Featured image from ChatGPT, chart from TradingView.com