
Ethereum (ETH) has breached the $4,200 milestone, showing renewed optimism among investors. However, analysts are divided on whether this rally signals a sustained uptrend or a possible bullish trap.
Ethereum soared above $4,200 on Monday, marking an important psychological threshold and reigniting discussions about the possibility of a medium-term bullish phase.
Structural factors behind the rise
Market watchers are closely monitoring certain indicators, including actual spot purchases, large order flow, and the balance of buying and selling pressure. These observations are based on analysis shared on X (formerly Twitter) by cryptocurrency analysts like @swarmister and @acethebullly, highlighting the current market structure and potential breakout scenarios.
Market research from analytics firms suggests a medium-term target range of $4,500 to $4,650, supported by fundamental factors. Ethereum benefits from expanding ecosystemThis includes the rapid development of decentralized finance (DeFi), increased demand for staking, and layer 2 scaling solutions.ion.
From a technical perspective, ETH’s rebound from the $3,900 level is consistent with a broader consolidation pattern. The 200-day moving average, currently near $3,568, is acting as long-term support, but traders will be watching to see if the price can maintain momentum above the 50-day and 100-day exponential moving averages.
Macro conditions could also favor an upward bias for ETH. A possible US interest rate cut and expectations for lower real yields could see a return of risk-on sentiment and a flow of liquidity into digital assets.
Crypto analyst @swarmister pointed out that Ethereum forms a “symmetrical triangle,” a consolidation pattern that typically follows an impulsive move.
“Price consolidation above $4,000 with increased volume and positive delta would support an upside scenario,” he said, adding that a breakout could push ETH towards $4,800 to $5,600.
$ETH Technology Overview
Main level:
Support: Current integration floor is $3,600-$3,700.
Goals if breakout is confirmed: $4,800 and $5,600(!)
If the price consolidates above $4,000 due to increased volume and positive delta, the upside scenario will be confirmed.Currently… pic.twitter.com/0E28DHNROz
— swarmik (@swarmister) October 26, 2025
These technical signals suggest that the recent breakout may be more than short-term volatility and may signal a structural shift in market sentiment.
Market resistance and downside risk
Still, analysts warn that enthusiasm may be premature. On-chain data shows that while spot inflows are limited, leveraged positions are increasing, indicating potential vulnerability to liquidation sales.
Technical analyst @acethebullly said the market is “range bound” and ETH is consolidating between $4,050 and $4,100.
“Liquidity concentration around $4,100 is acting as a strong resistance level,” he said, adding that despite significant buy absorption near $4,050, large sell orders are holding back gains. “Buyers are defending this area, but a thick sell wall above $4,100 continues to limit upside momentum.”
$ETH is exhibiting a sideways consolidation period between approximately $4,050 and $4,100, with a significant concentration of liquidity around $4,100 acting as strong resistance. Large sell orders early in the session (red bubble) caused prices to fall, but buy absorption increased (green bubble)… pic.twitter.com/lqzcjyFRSs
— Trading Ace (@acethebullly) October 26, 2025
This liquidity balance highlights Ethereum’s current inflection point. Unless ETH breaks above $4,150 on solid volume, a sustained rally may still be difficult. Furthermore, Bitcoin (BTC) still dominates the overall market momentum, making it difficult for ETH to move forward on its own.
If Ethereum fails to sustain support at $4,000, analysts see a possible retracement below $3,900. Broader macro risks, such as tight liquidity, new regulatory pressures and unfavorable changes in investor sentiment, could also weigh on prices.
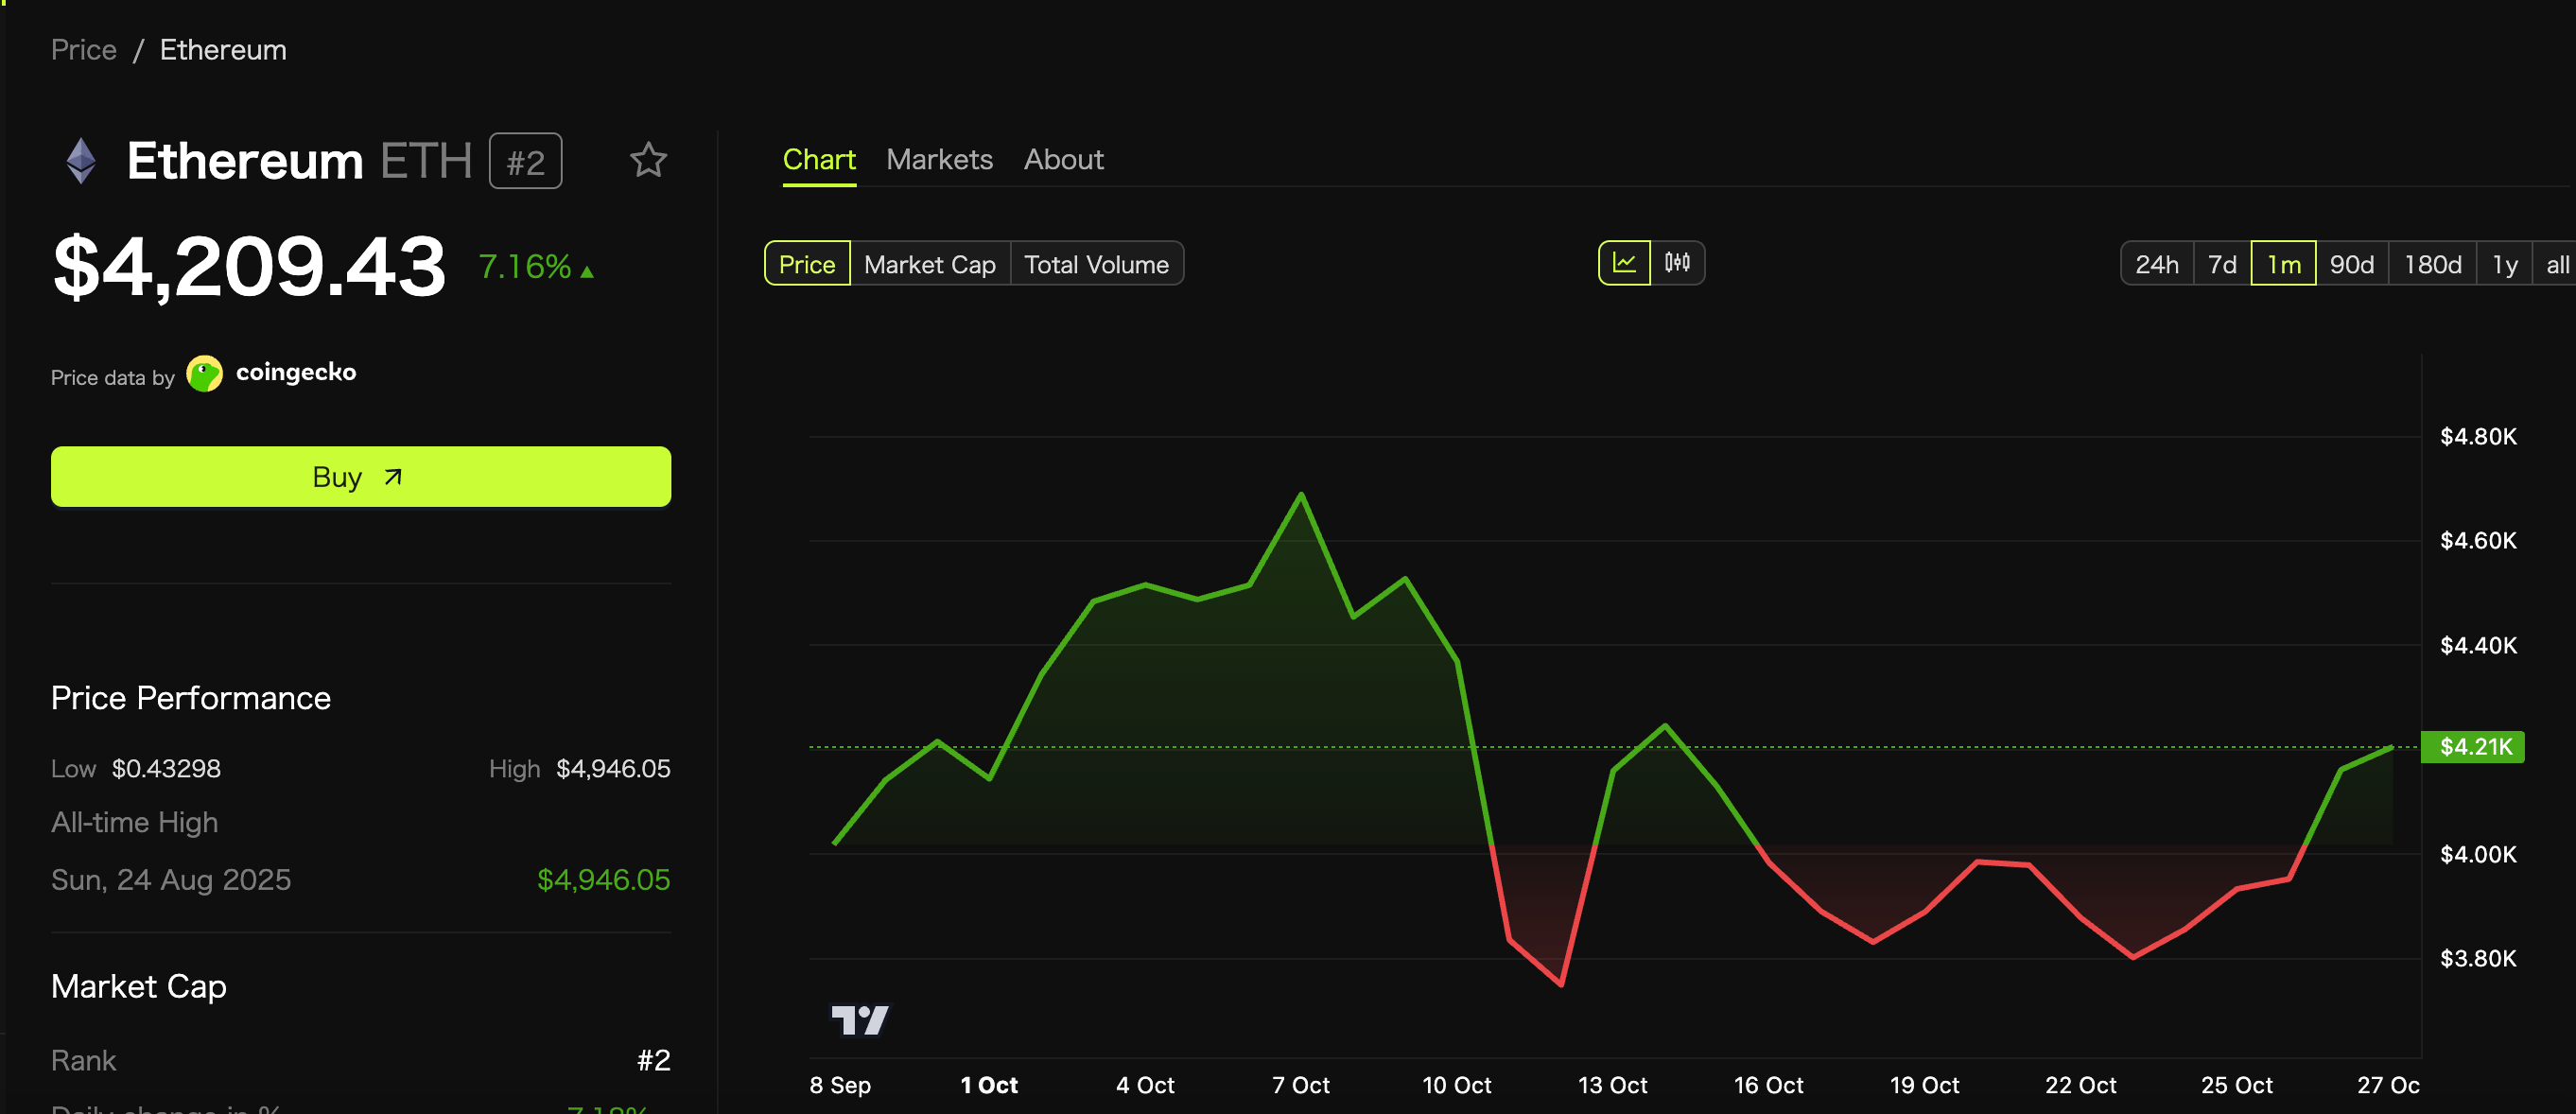
ETH Price Chart: BeInCrypto
Can ETH reach $4,500 by the end of 2025?
A decisive move above $4,150-4,220 could confirm the breakout and pave the way to $4,400-4,550. Once market liquidity improves and the macro environment stabilizes, these developments would be in line with the bullish forecasts outlined by several analysts.
Conversely, failure to overcome resistance may prolong the adjustment phase and delay sustained progress. If the sell wall continues and spot demand weakens, Ethereum could remain range bound until the end of the year.
Overall, the chances of ETH reaching $4,500 by the end of the year will largely depend on short-term price trends, especially whether the ongoing accumulation leads to confirmation of a technical breakout.
Key metrics to watch include:
- Spot purchase activity: Measures actual purchases of ETH on exchanges, indicating actual demand and market participation.
- leverage ratio: Shows the proportion of borrowed capital in the derivatives market and highlights liquidation risk.
- Liquidity heat map: Visualize areas in the order book where buy or sell orders are concentrated and often act as support or resistance.
- ETH/BTC performance: Tracks the relative strength of Ethereum against Bitcoin and shows whether ETH movement is independent or BTC-driven.
These indicators are derived from technical observations of analysts. For example, @swarmister pointed out the importance of volume in determining symmetrical triangle formation and upward momentum. @acethebullly highlighted how concentrated liquidity around $4,100 acts as a strong resistance line and how a buy order around $4,050 protects support.
Monitoring these indicators can reveal whether the recent breakout is fueled by true demand or if it is susceptible to a pullback.
The post ETH Breaks Above $4,200 — Can It Reach $4,500 By The End Of The Year?The post appeared first on BeInCrypto.