Ethereum continues to hover around the $3,000 zone, with neither the bulls nor the bears fully in control. The market has entered a correction phase after failing to sustain above $3,100, and traders are currently closely monitoring key levels on both the daily and 4-hour charts. Macro structures remain under pressure, but near-term sentiment and positioning suggest potential for future volatility.
Ethereum Price Analysis: Daily Chart
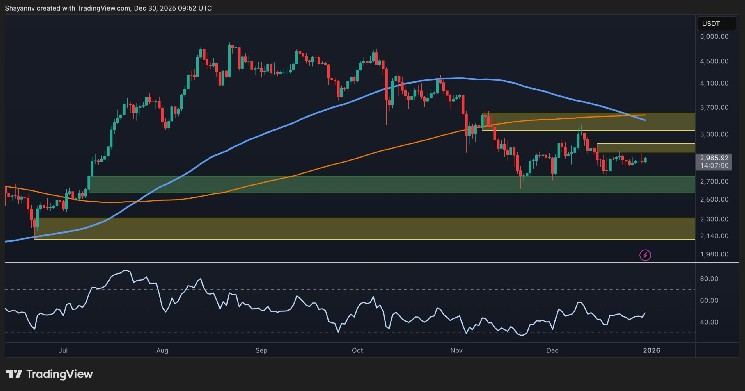
On the daily chart, ETH remains below both the 200-day moving average and the 100-day moving average, still acting as dynamic resistance above the $3,500 level. The price failed to sustain above the $3,100-$3,200 resistance block and is currently hovering just below that range, near $2,980. The lack of highs suggests that bearish pressure will continue.
Still, the $2,700 support zone remains an area of strong demand and has supported the price many times over the past few months. As long as ETH remains above that zone, downside risk is somewhat limited. However, losing that support could accelerate the decline and open the door to $2,300 territory.
ETH/USDT 4 hour chart
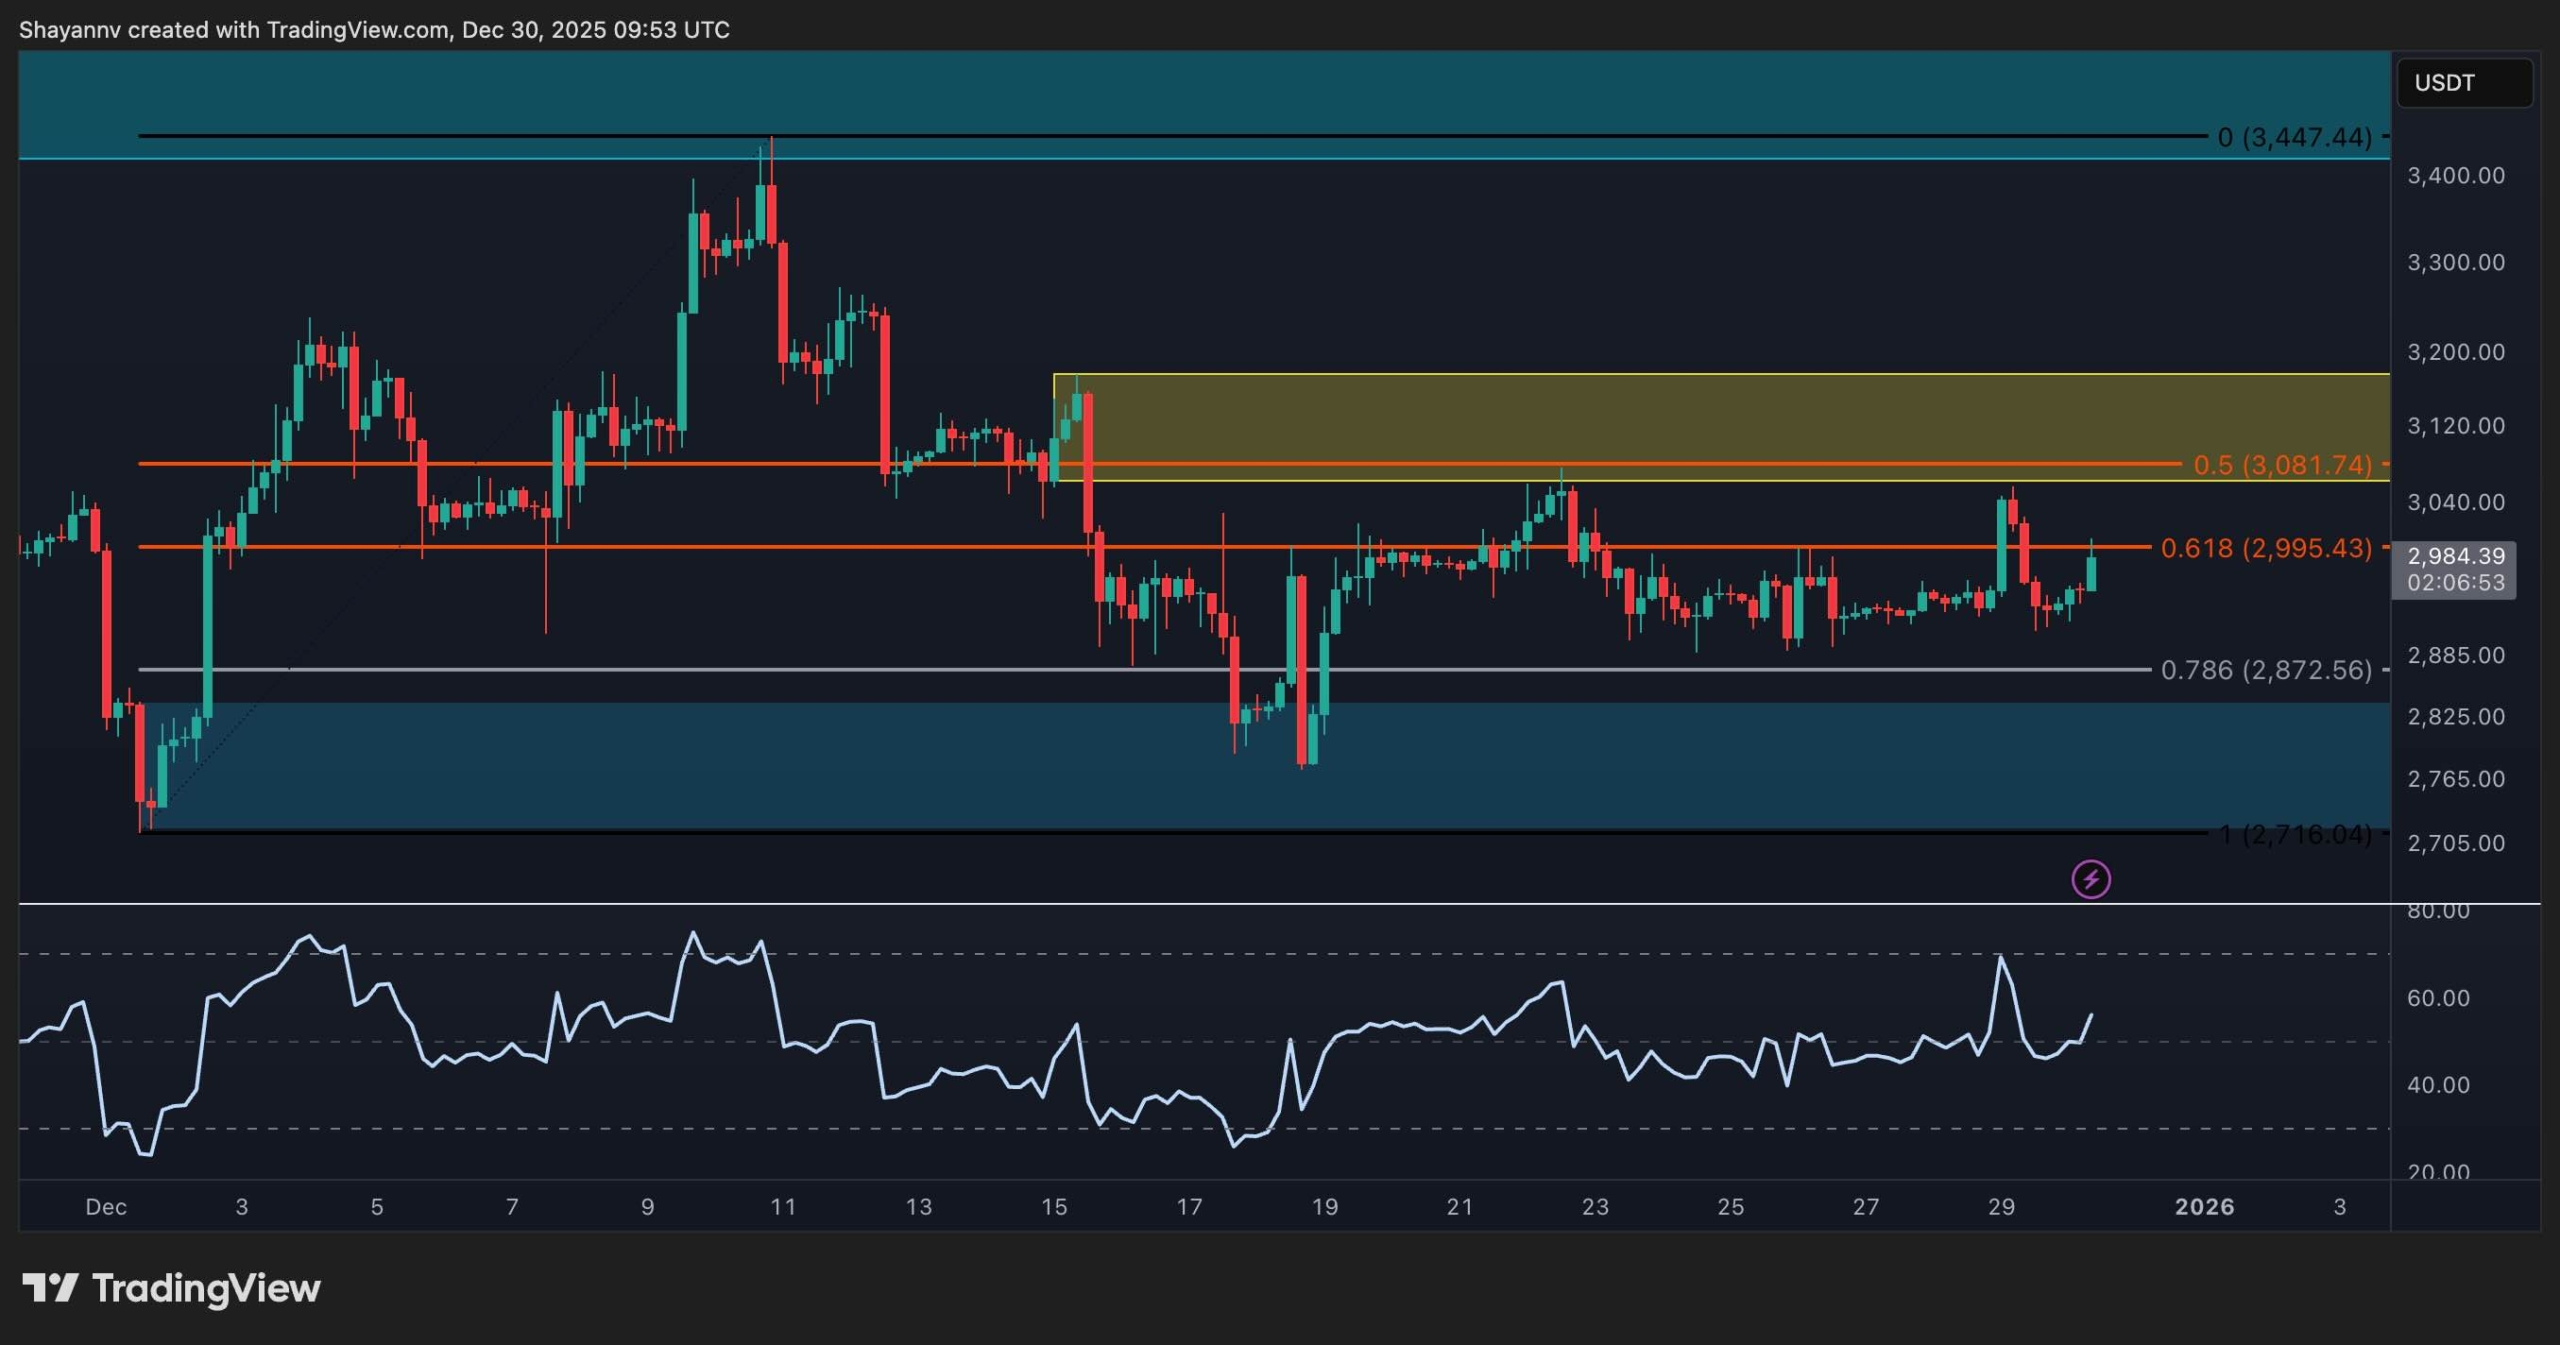
Zooming in on the 4-hour chart, the asset has consolidated between $2,800 and $3,000 over the past week. The Fibonacci retracement level pulled from the early December rally shows that the 0.618-0.5 zone below the $3,000 zone has been acting as a strong ceiling recently. So far, all attempts to breakout beyond that have been rejected.
Meanwhile, the 4-hour RSI is slowly climbing towards 60, indicating some momentum is building, but not convincing yet. Buyers need to break out and sustain the $3,000 level to gain short-term control. Until then, it’s still a volatile range with a slight bearish trend. Therefore, price movements remain reactive rather than proactive.
sentiment analysis
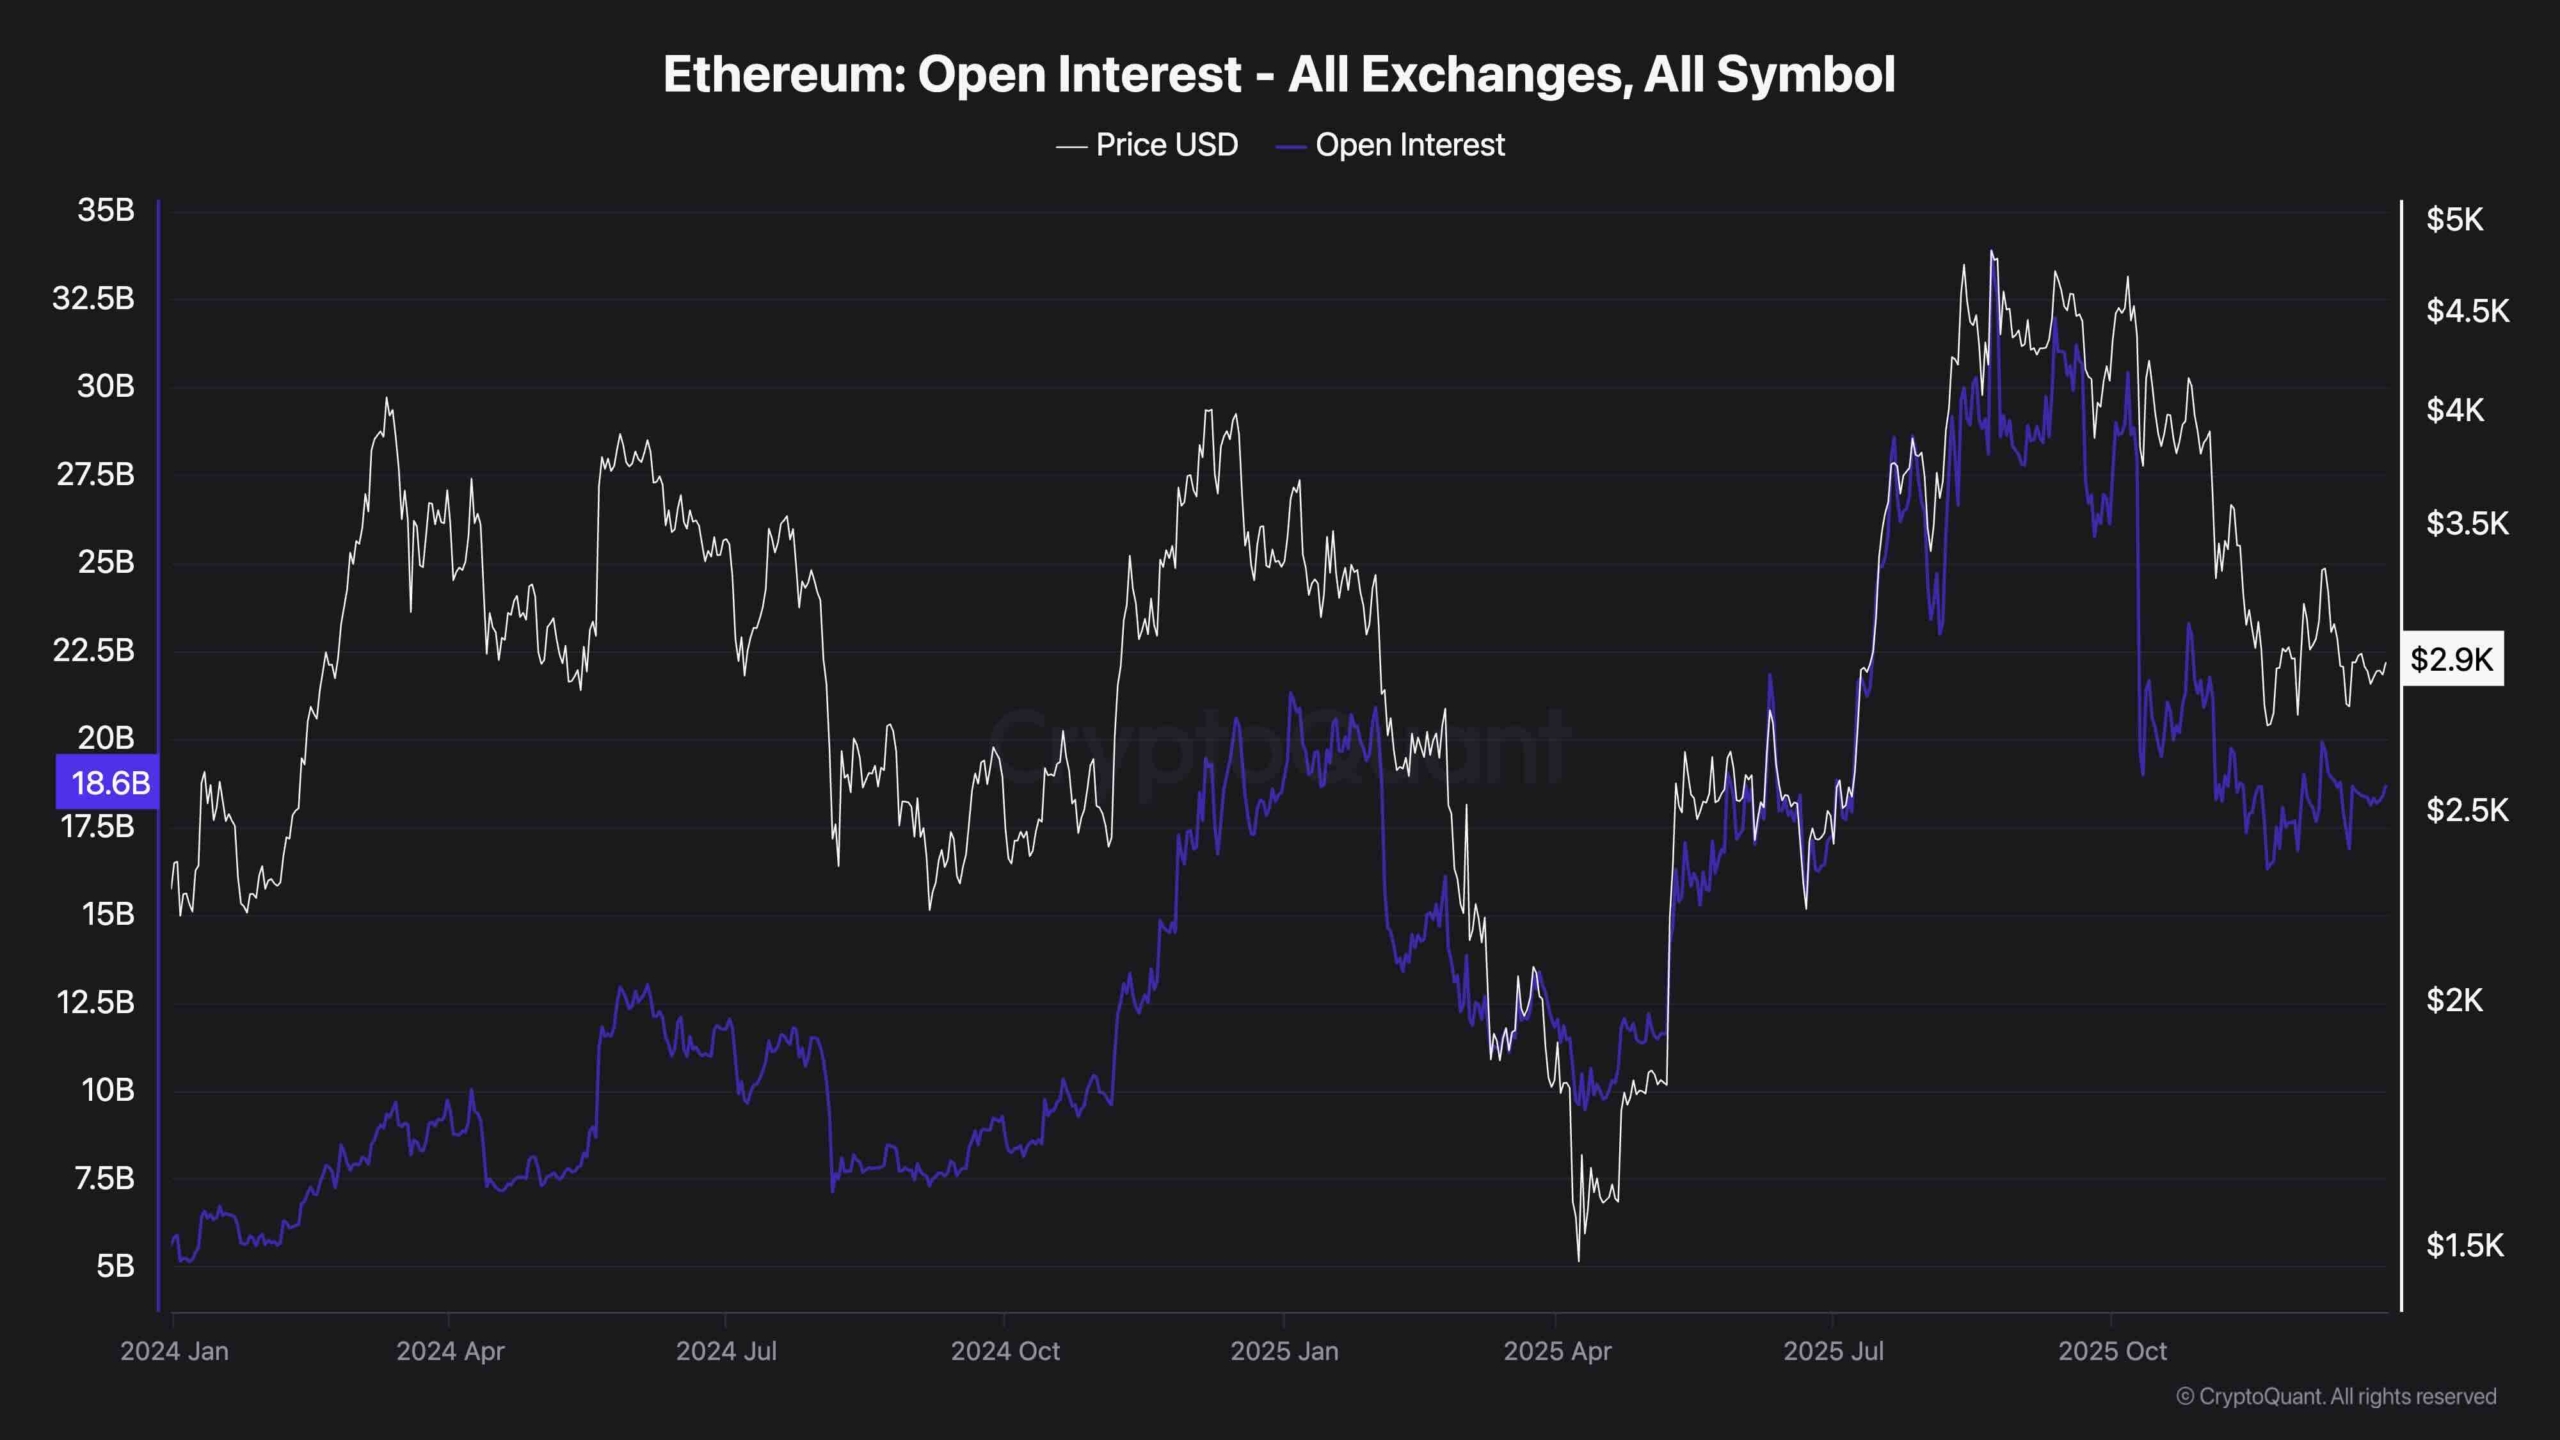
Ethereum’s open interest has been steadily declining since its peak in mid-November, showing active position reduction from both bulls and bears. Reflecting the uncertainty and lack of confidence in the current market direction, OI is now below $20 billion from a high of about $32 billion.
This cooling of leverage is often seen before big moves. The market is basically reset. Now, if the OI starts rising again while the price stays flat, it could indicate a return of speculative interest and could lead to volatility. Therefore, traders should be wary of sudden spikes in both OI and volume. This could support a breakout attempt or a new bar downside.