
Ethereum is trading near $1,939 as of March 8, 2026, hovering near short-term support as technical indicators across multiple time frames suggest the market lacks strong upward momentum. So even though liquidity is healthy and participants are present, the chart continues to behave like a trader who showed up to the party but refused to dance.
Ethereum chart outlook
On the daily chart, Ethereum remains below the long-term trend indicators, highlighting a broader correction structure. Price action remains below the $2,000 psychological level, forming a consolidation move within a multi-month broad downtrend channel.
Long-term bias is therefore defined by gravity, not drama. Attempts to recover toward resistance around $1,980 to $2,000 have repeatedly faltered, leaving the $1,930 zone as traders in the immediate support band watch like hawks guarding a particularly vulnerable nest.
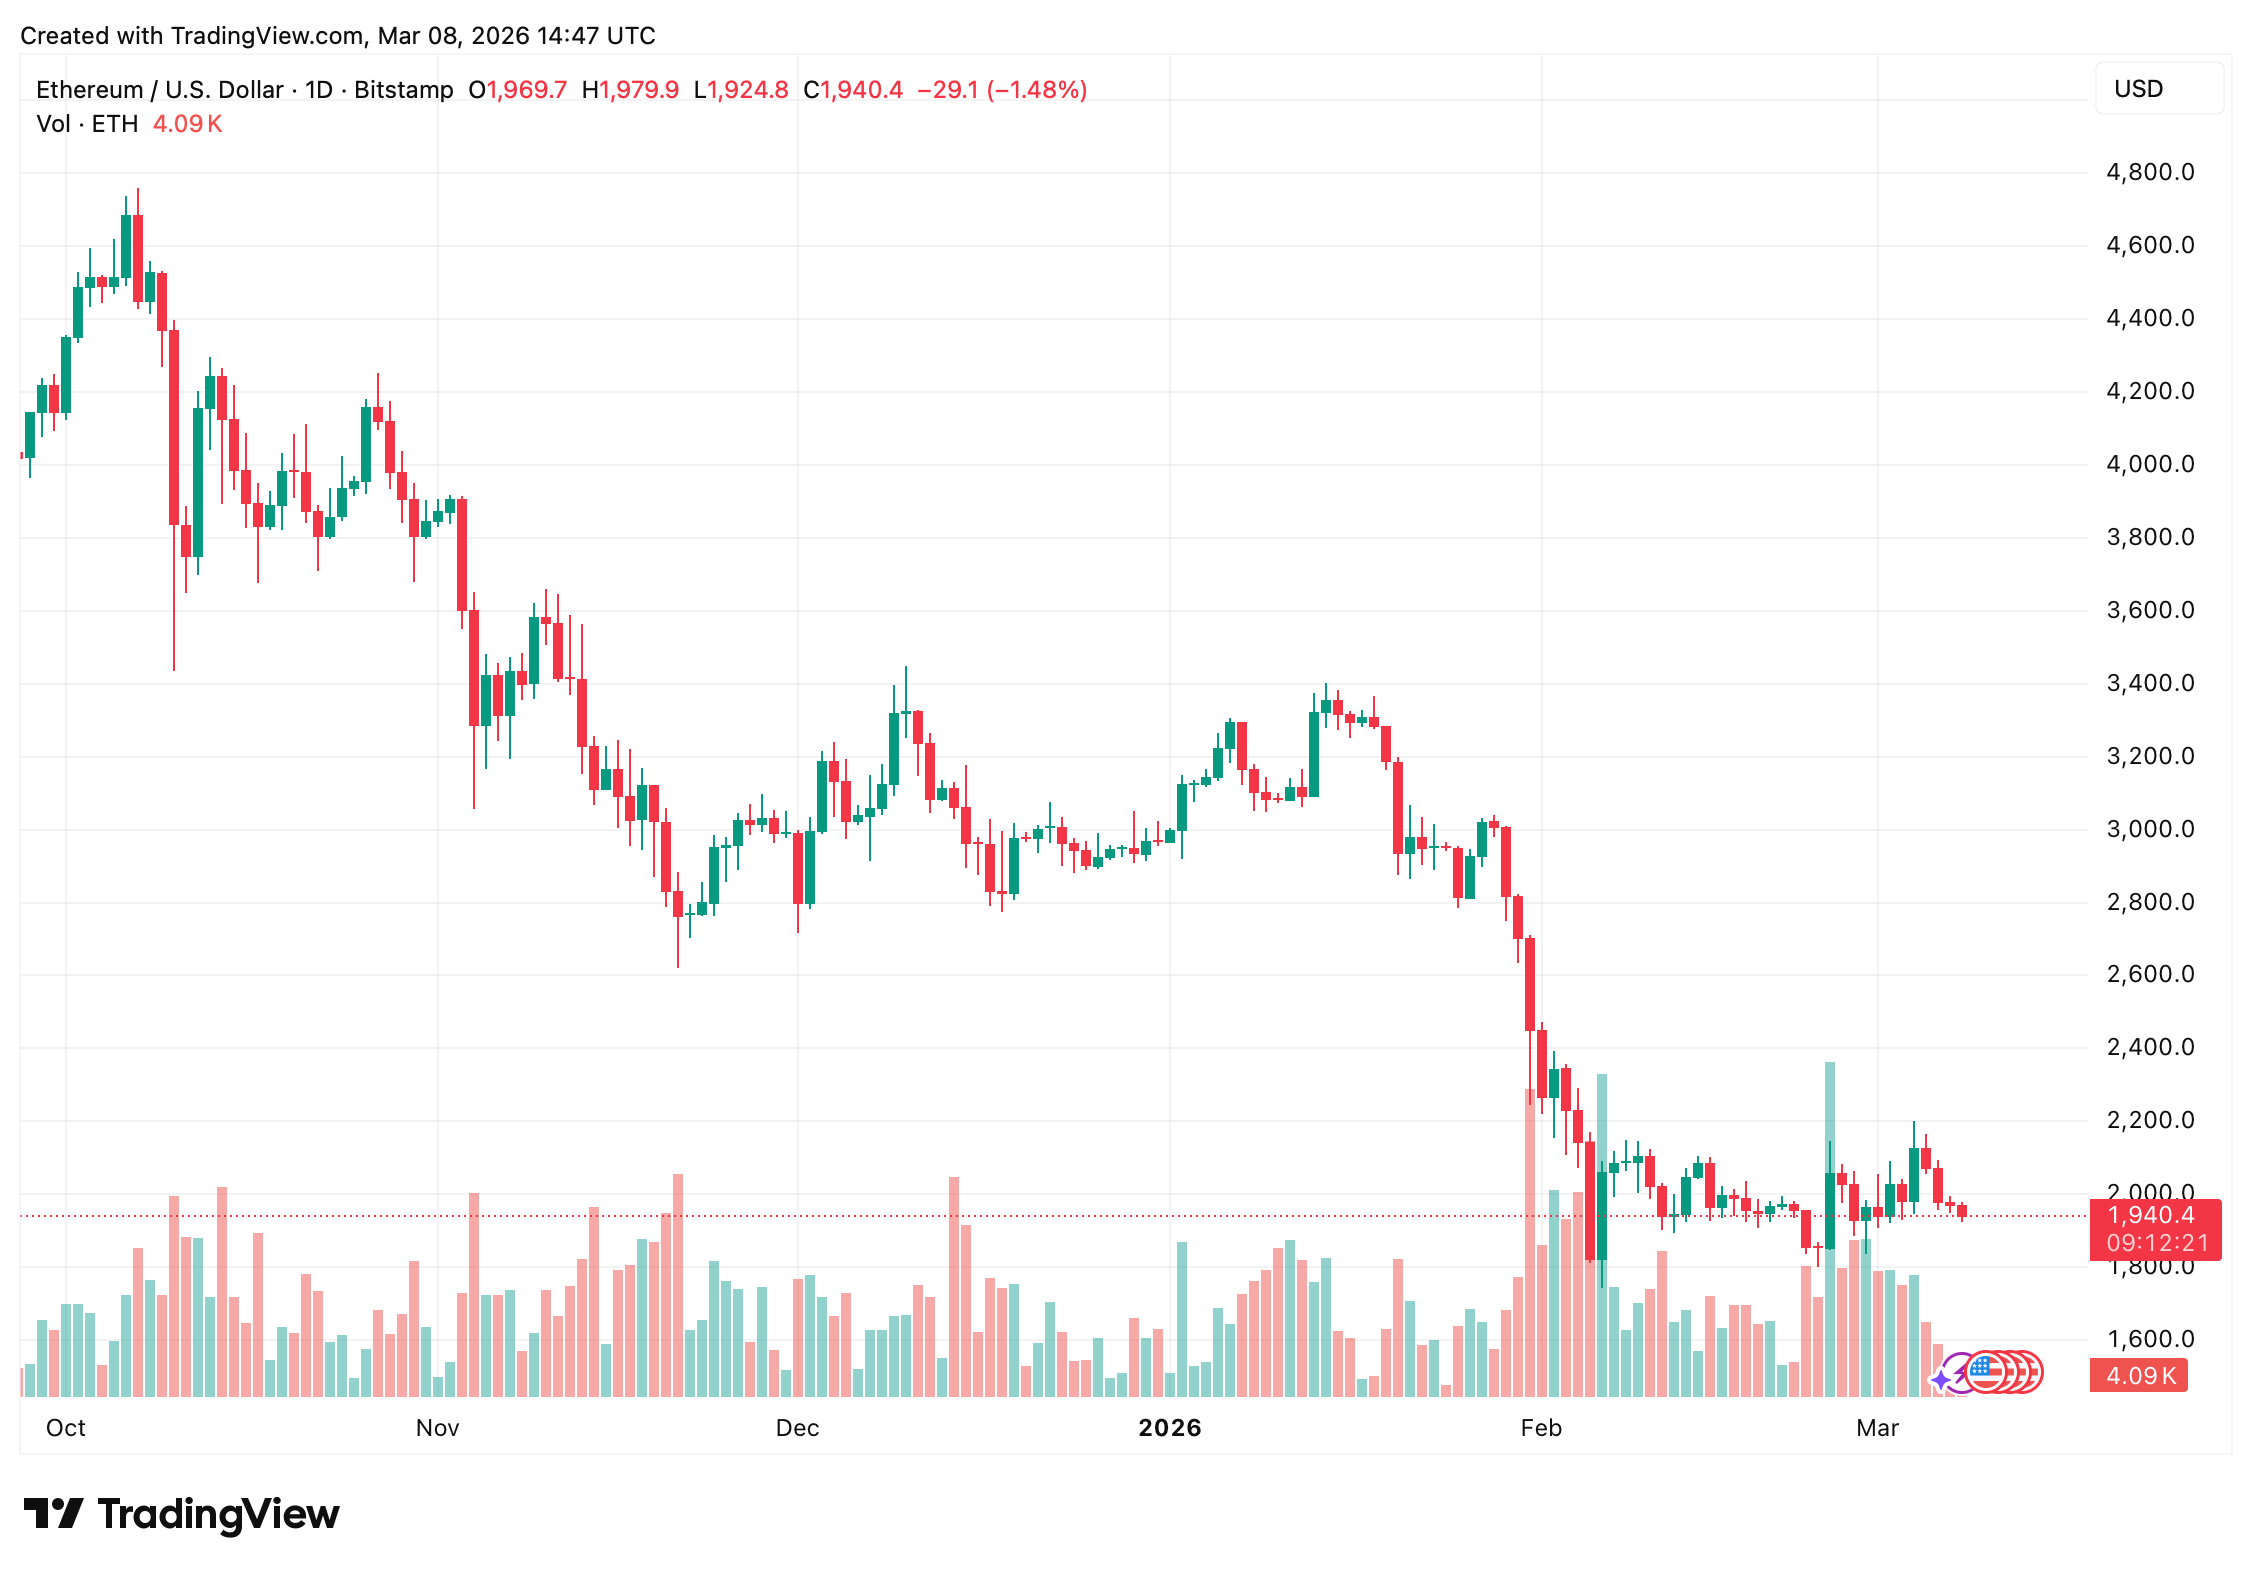
$ETH/USD 1-day chart via Bitstamp on March 8, 2026.
The 4-hour chart of Ether shows a consolidation with a mild bearish tilt after a rejection near the $1,960 to $1,980 area. The candlestick in the $1,930 to $1,940 range reflects indecision rather than belief, which typically translates, in market terms, to a conflict between impatient momentum traders and long-term participants waiting for confirmation. Resistance remains layered around the $1,980 and $2,000 thresholds, with downside support extending from around $1,930 towards the $1,880-$1,900 band. In other words, the market is compressed, and compression rarely lasts forever.
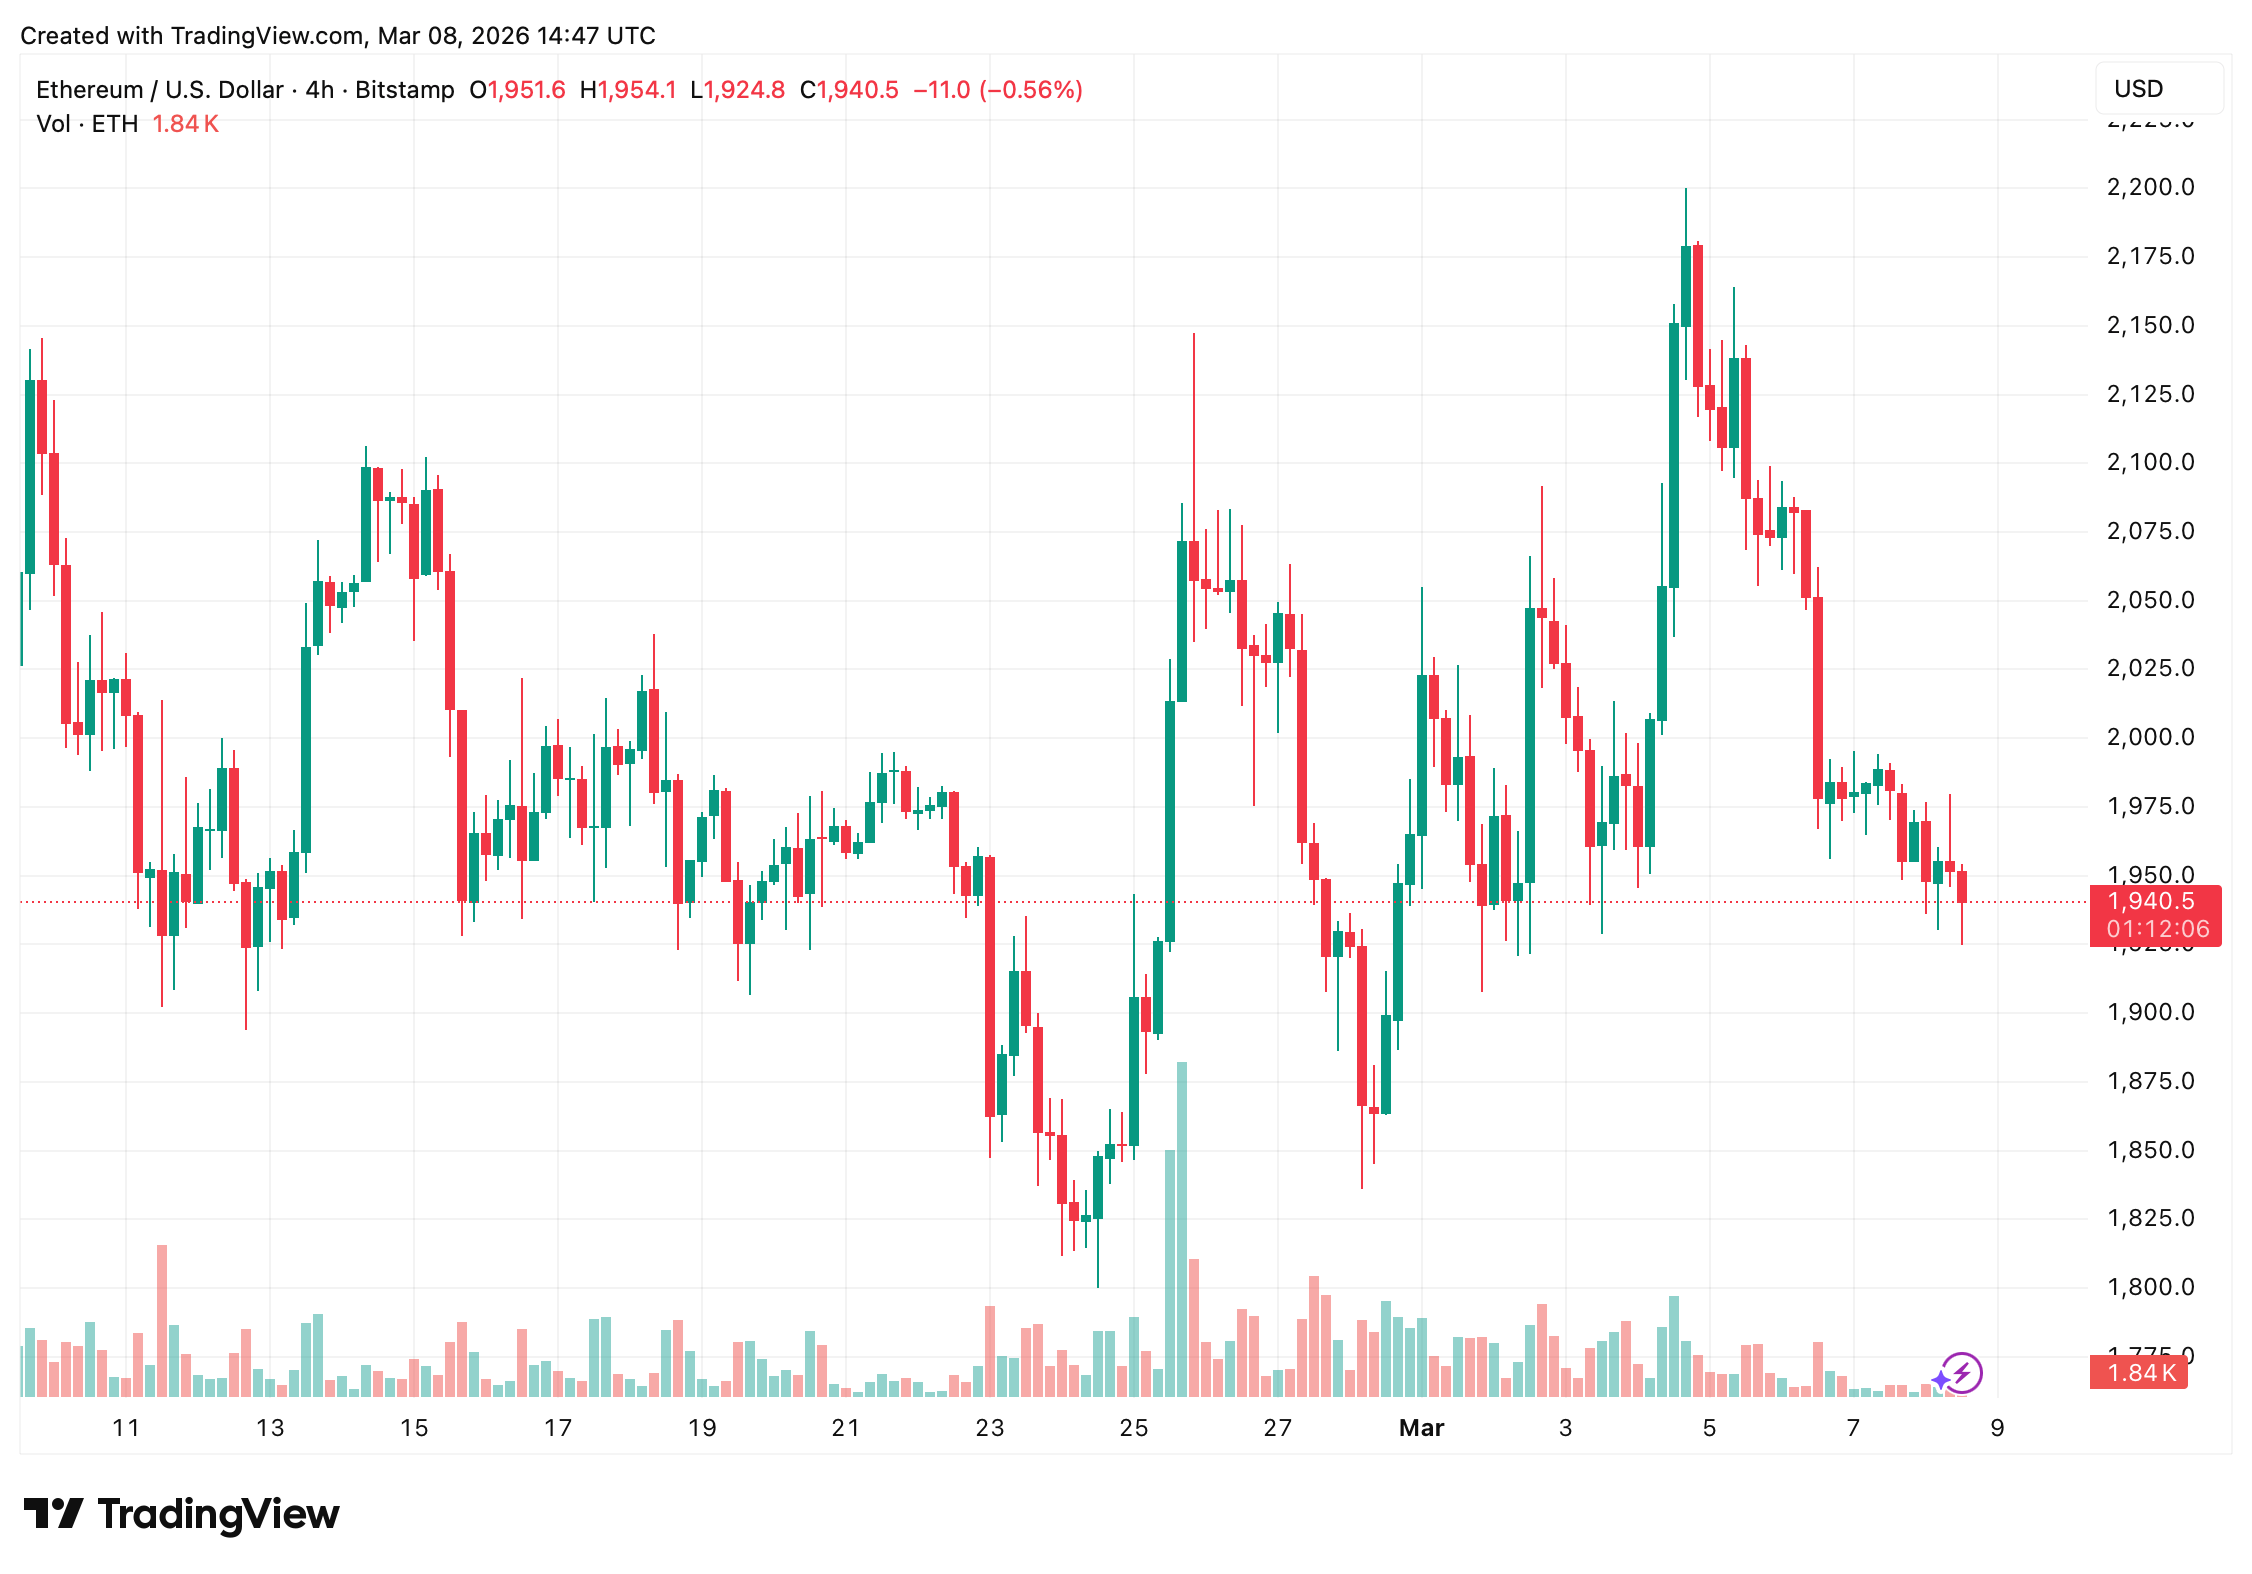
$ETH/USD 4-hour chart via Bitstamp on March 8, 2026.
The short-term movement on the hourly chart reflects small fluctuations around the current price level and continued rejection around the downtrend line in the $1,960 to $1,980 area. Momentum signals are showing limited strength in either direction, reinforcing the sense that the market is testing support rather than initiating a definitive move. The Relative Strength Index (RSI) is 42.4, while the Stochastic Oscillator outputs 40.4 and the Commodity Channel Index (CCI) is -47.7. The average directional index (ADX) is 29.9, suggesting that the trend is present but lacks overwhelming strength.
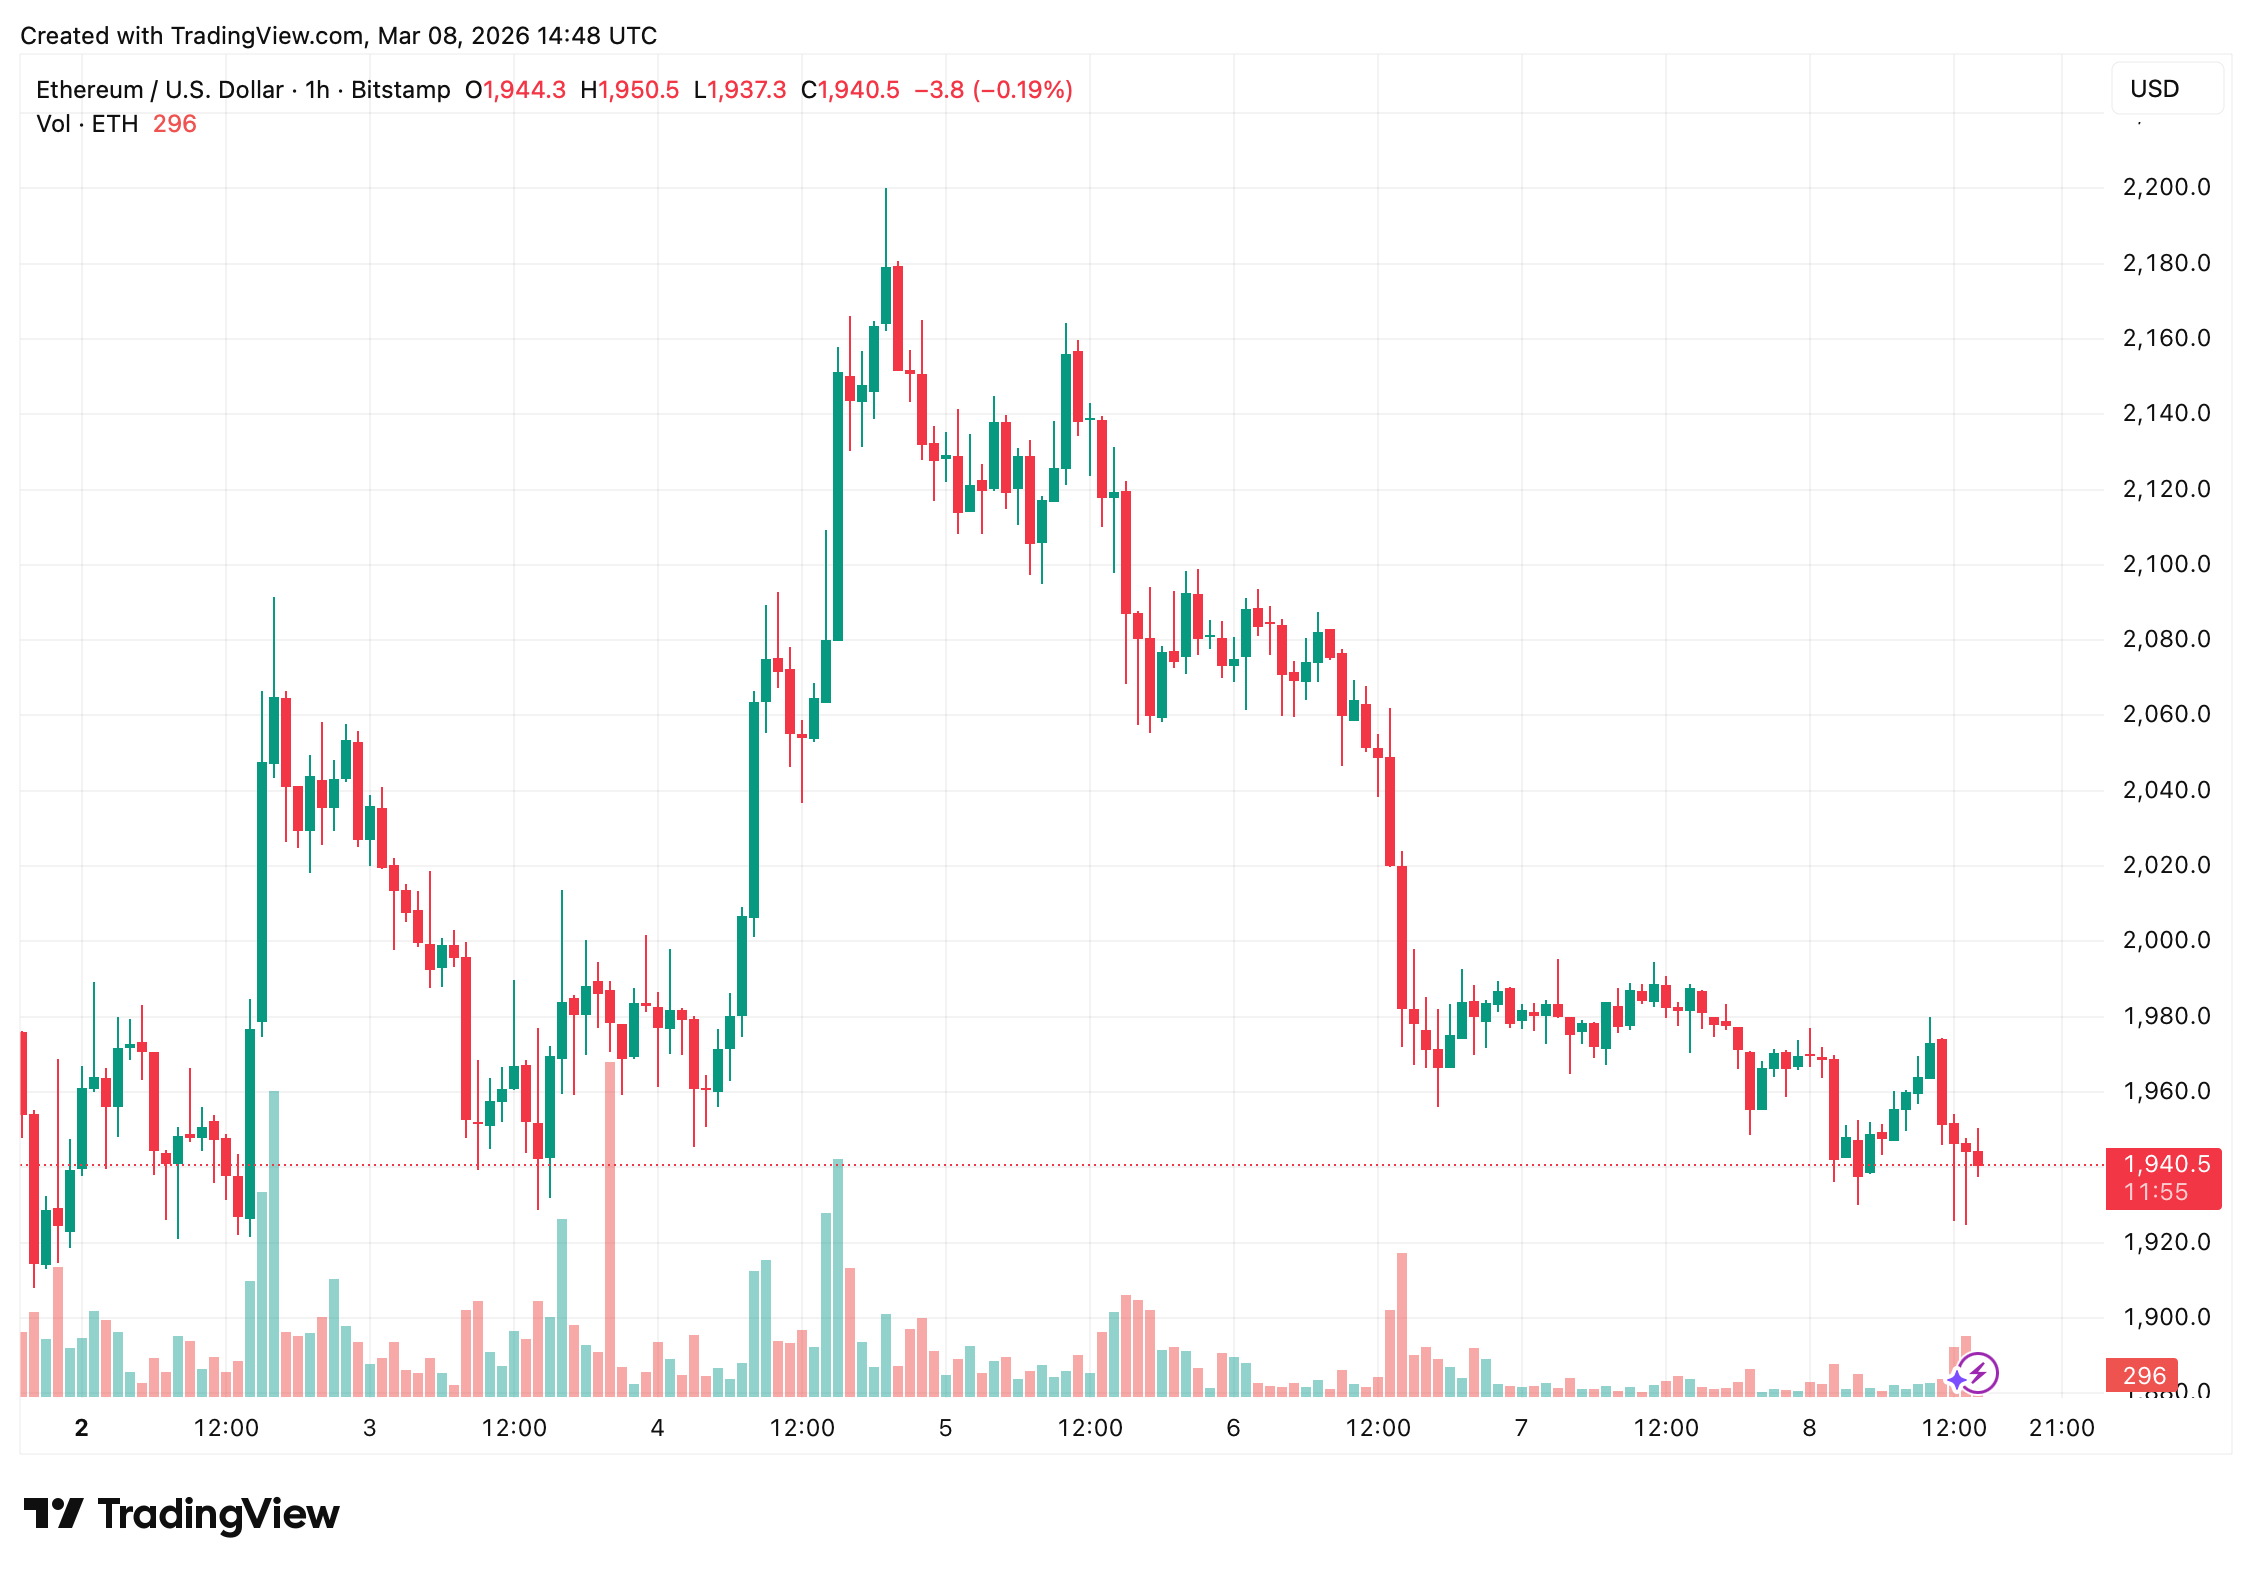
$ETH/USD 1-hour chart via Bitstamp on March 8, 2026.
However, Ether’s moving average (MA) tells a less diplomatic story. Almost all major trend indicators are above the current price level, forming a technical resistance ceiling. The shorter interval exponential moving average (EMA) and simple moving average (SMA) are both above the spot price. This includes the $1,990 EMA (10) and $1,993 SMA (10), followed by the $2,017 EMA (20) and $1,975 SMA (20).
Higher period indicators further widen the gap, with the $2,249 EMA (50), $2,272 SMA (50), $2,587 EMA (100), and $2,673 SMA (100) all well above. Longer-term trend markers such as the $2,899 EMA (200) and $3,324 SMA (200) reinforce the broader bearish structure.
Fundamentally, the technical situation is neither chaotic nor particularly optimistic. The oscillator is leaning toward neutral, suggesting that momentum has not reached extreme conditions, but the overwhelming coincidence of moving averages above the market is reinforcing the prevailing downward pressure.
Ethereum’s current position near $1,930 thus represents a careful balancing act rather than a winning position. If the price regains the $1,980-$2,000 area, the tone on the chart could change. Until then, the technical situation continues to resemble a market that is politely trapped under a very large ceiling.
Bullish verdict:
If Ethereum is able to stabilize above the $1,930 support zone and reclaim the $1,980-$2,000 resistance band, the technical posture could shift from heightened defenses to an early-stage recovery. The oscillator, currently in neutral territory, leaves room for upward momentum to develop, especially as the Moving Average Convergence Divergence (MACD) is already indicating a possible bullish crossover. A sustained rise above the Ichimoku reference line around $1,999 would bring the price back within a psychologically important range and open the door to a test of higher resistance levels as momentum traders regain confidence.
Bear verdict:
Despite the neutral oscillator, the broader trend structure remains under strong pressure as prices trade below nearly all major exponential moving averages (EMAs) and simple moving averages (SMAs) over short, medium and long-term time horizons. A continued rejection below the $1,980-$2,000 resistance corridor, coupled with a breakdown below the $1,930 support, will strengthen the existing bearish structure. In that scenario, the chart would likely shift focus to the $1,880 to $1,900 support zone, with the moving average’s heavy overhead cluster continuing to act as a persistent technical ceiling.
Frequently asked questions 🔎
- Why is Ethereum trading below $2,000?
Ethereum remains below $2,000 as strong resistance from multiple moving averages continues to dampen price upward momentum. - What are Ethereum’s technical indicators currently showing?
Most oscillators show neutral momentum, while moving averages show a strong bearish trend. - What are Ethereum’s major support and resistance levels?
Immediate support is located near $1,930, with resistance concentrated between $1,980 and $2,000. - What could move Ethereum’s price next?
A decisive break above $2,000 or below $1,930 could determine Ethereum’s next direction.