
- Ethereum price correction is heading towards a bearish breakdown from the support trend line of the head and shoulders pattern.
- Ethereum exchange balances decreased to around 0.137, matching levels last seen during the early stages of the network in 2016.
- The sharp decline in the Relative Strength Index (RSI) highlights the active selling pressure in the current price trend.
On Wednesday, December 17th, Ethereum price fell by 4.6% and is currently trading at $4.66. The selling pressure came amid large outflows from the U.S.-based Spot ETH ETF, as well as growing uncertainty over the Bank of Japan’s future interest rate decisions. While market sentiment prompts further price correction, on-chain indicators highlight strong confidence from investors, which could strengthen fundamental support for the price bottom in the near term.
Ethereum exchange reserves fall to 2016 lows as holders move ETH off the platform
On-chain metrics reveal that Ethereum holders are transferring large amounts of tokens from the trading platform. The total amount of ETH stored across centralized exchanges has fallen to approximately 0.137, which is the same level reached in the early days of the network in 2016. This decrease represents net transfers to private wallets compared to deposits for quick transactions.
Data from major venues shows that fewer coins are available on the spot market. Traders clearly prefer to have assets outside of exchanges, reducing the number of assets ready for immediate trading.
On Binance, the leader in trading volume, the proportion of ETH in reserves is close to 0.0325, which is low compared to recent values. Withdrawals from the platform exceeded inflows, reducing the number of tokens in the pool sold in spot sales.
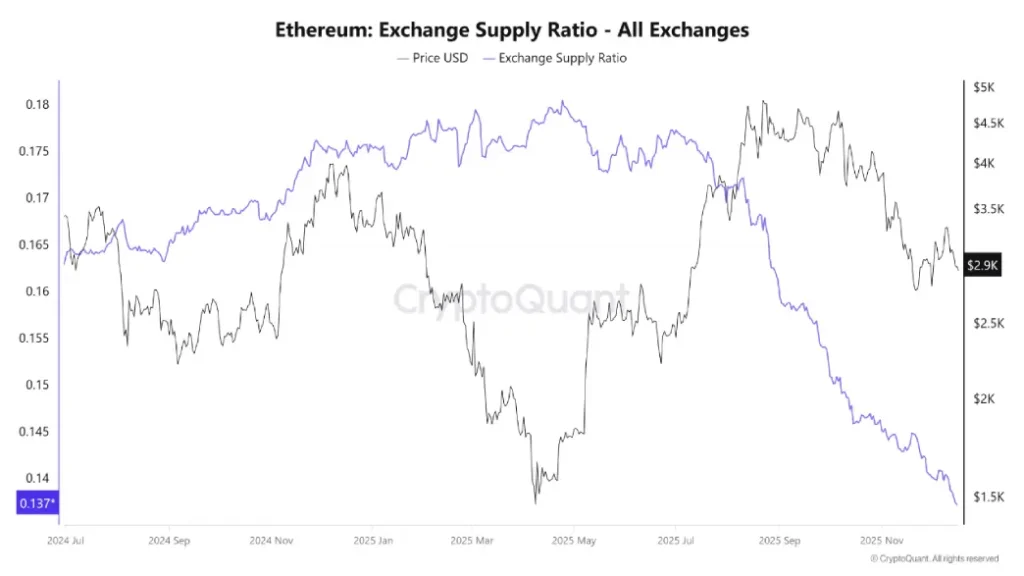
Ethereum is currently trading at around $2,960. This level is within the recent trading range, and although exchange holdings continue to fluctuate, there has been no sharp decline. Low trading volumes on the platform are consistent with stable pricing, as available liquidity is siphoned off from other uses.
Ethereum price is 2% away from major support breakdown
Over the past month, Ethereum’s price has plummeted from $3,450 to its current trading price of $2,830, marking an 18% loss. This decline indicates a new downside formation on the daily chart and directly reflects the reversal selling sentiment among market participants.
However, a broader analysis of Ethereum price shows that this decline is part of a traditional reversal pattern known as a head and shoulders. The chart setup is characterized by three peaks: the left shoulder, the head, and the right shoulder, generally found at the top of a major market and reflecting a bearish shift in market sentiment.
The coin price is currently less than 2% away from challenging the bottom trendline of the pattern, shown as a long-term uptrendline in the chart below. A bearish break below this support will complete the pattern and accelerate selling pressure on the price. The momentum indicator RSI at 37% further supports the risk of a bearish breakdown among sellers.
The post-crash decline could push the price down another 23.5% and retest the psychological level of $2,000.
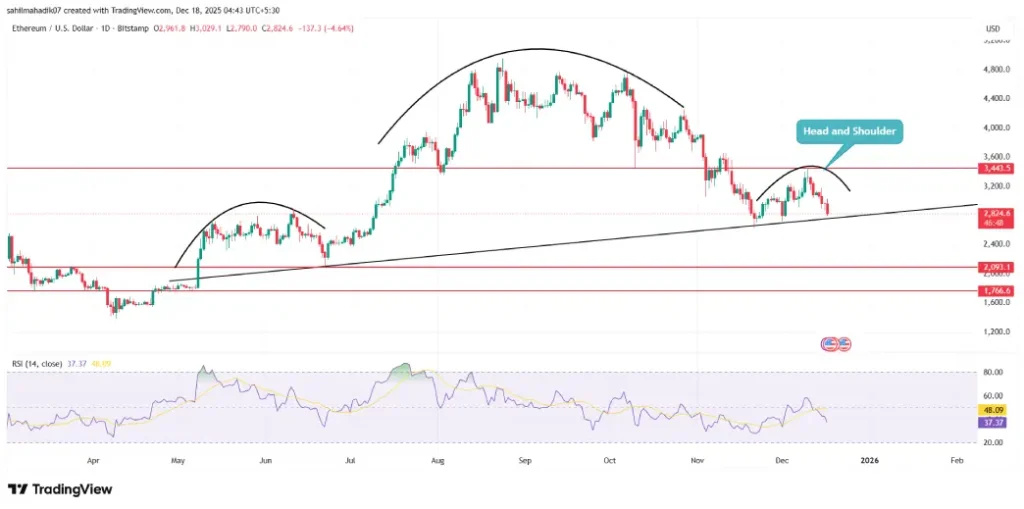
ETH/USDT-1d chart
Conversely, if the coin price shows sustainability above the uptrend line, buyers would need to break out above $3,450 to expect a meaningful rebound.