
Ethereum came dangerously close to breaking the $3,000 mark, briefly falling to $3,053 before rebounding. The decline shook the market, causing liquidations and panic selling. But after weeks of steady decline, we are finally starting to see early signs of recovery.
Despite falling 27% in the past month and 8.4% in the past 24 hours, both technical and on-chain data suggest that Ethereum may have formed a local bottom.
Early rebound settings appear on the chart
Ethereum price movements over the past few weeks indicate that bearish momentum is slowing.
On the 12-hour chart, Ethereum’s Relative Strength Index (RSI), which measures price momentum indicating whether an asset is overbought or oversold, has started forming higher lows, even though the price made lower lows between September 25th and November 4th.
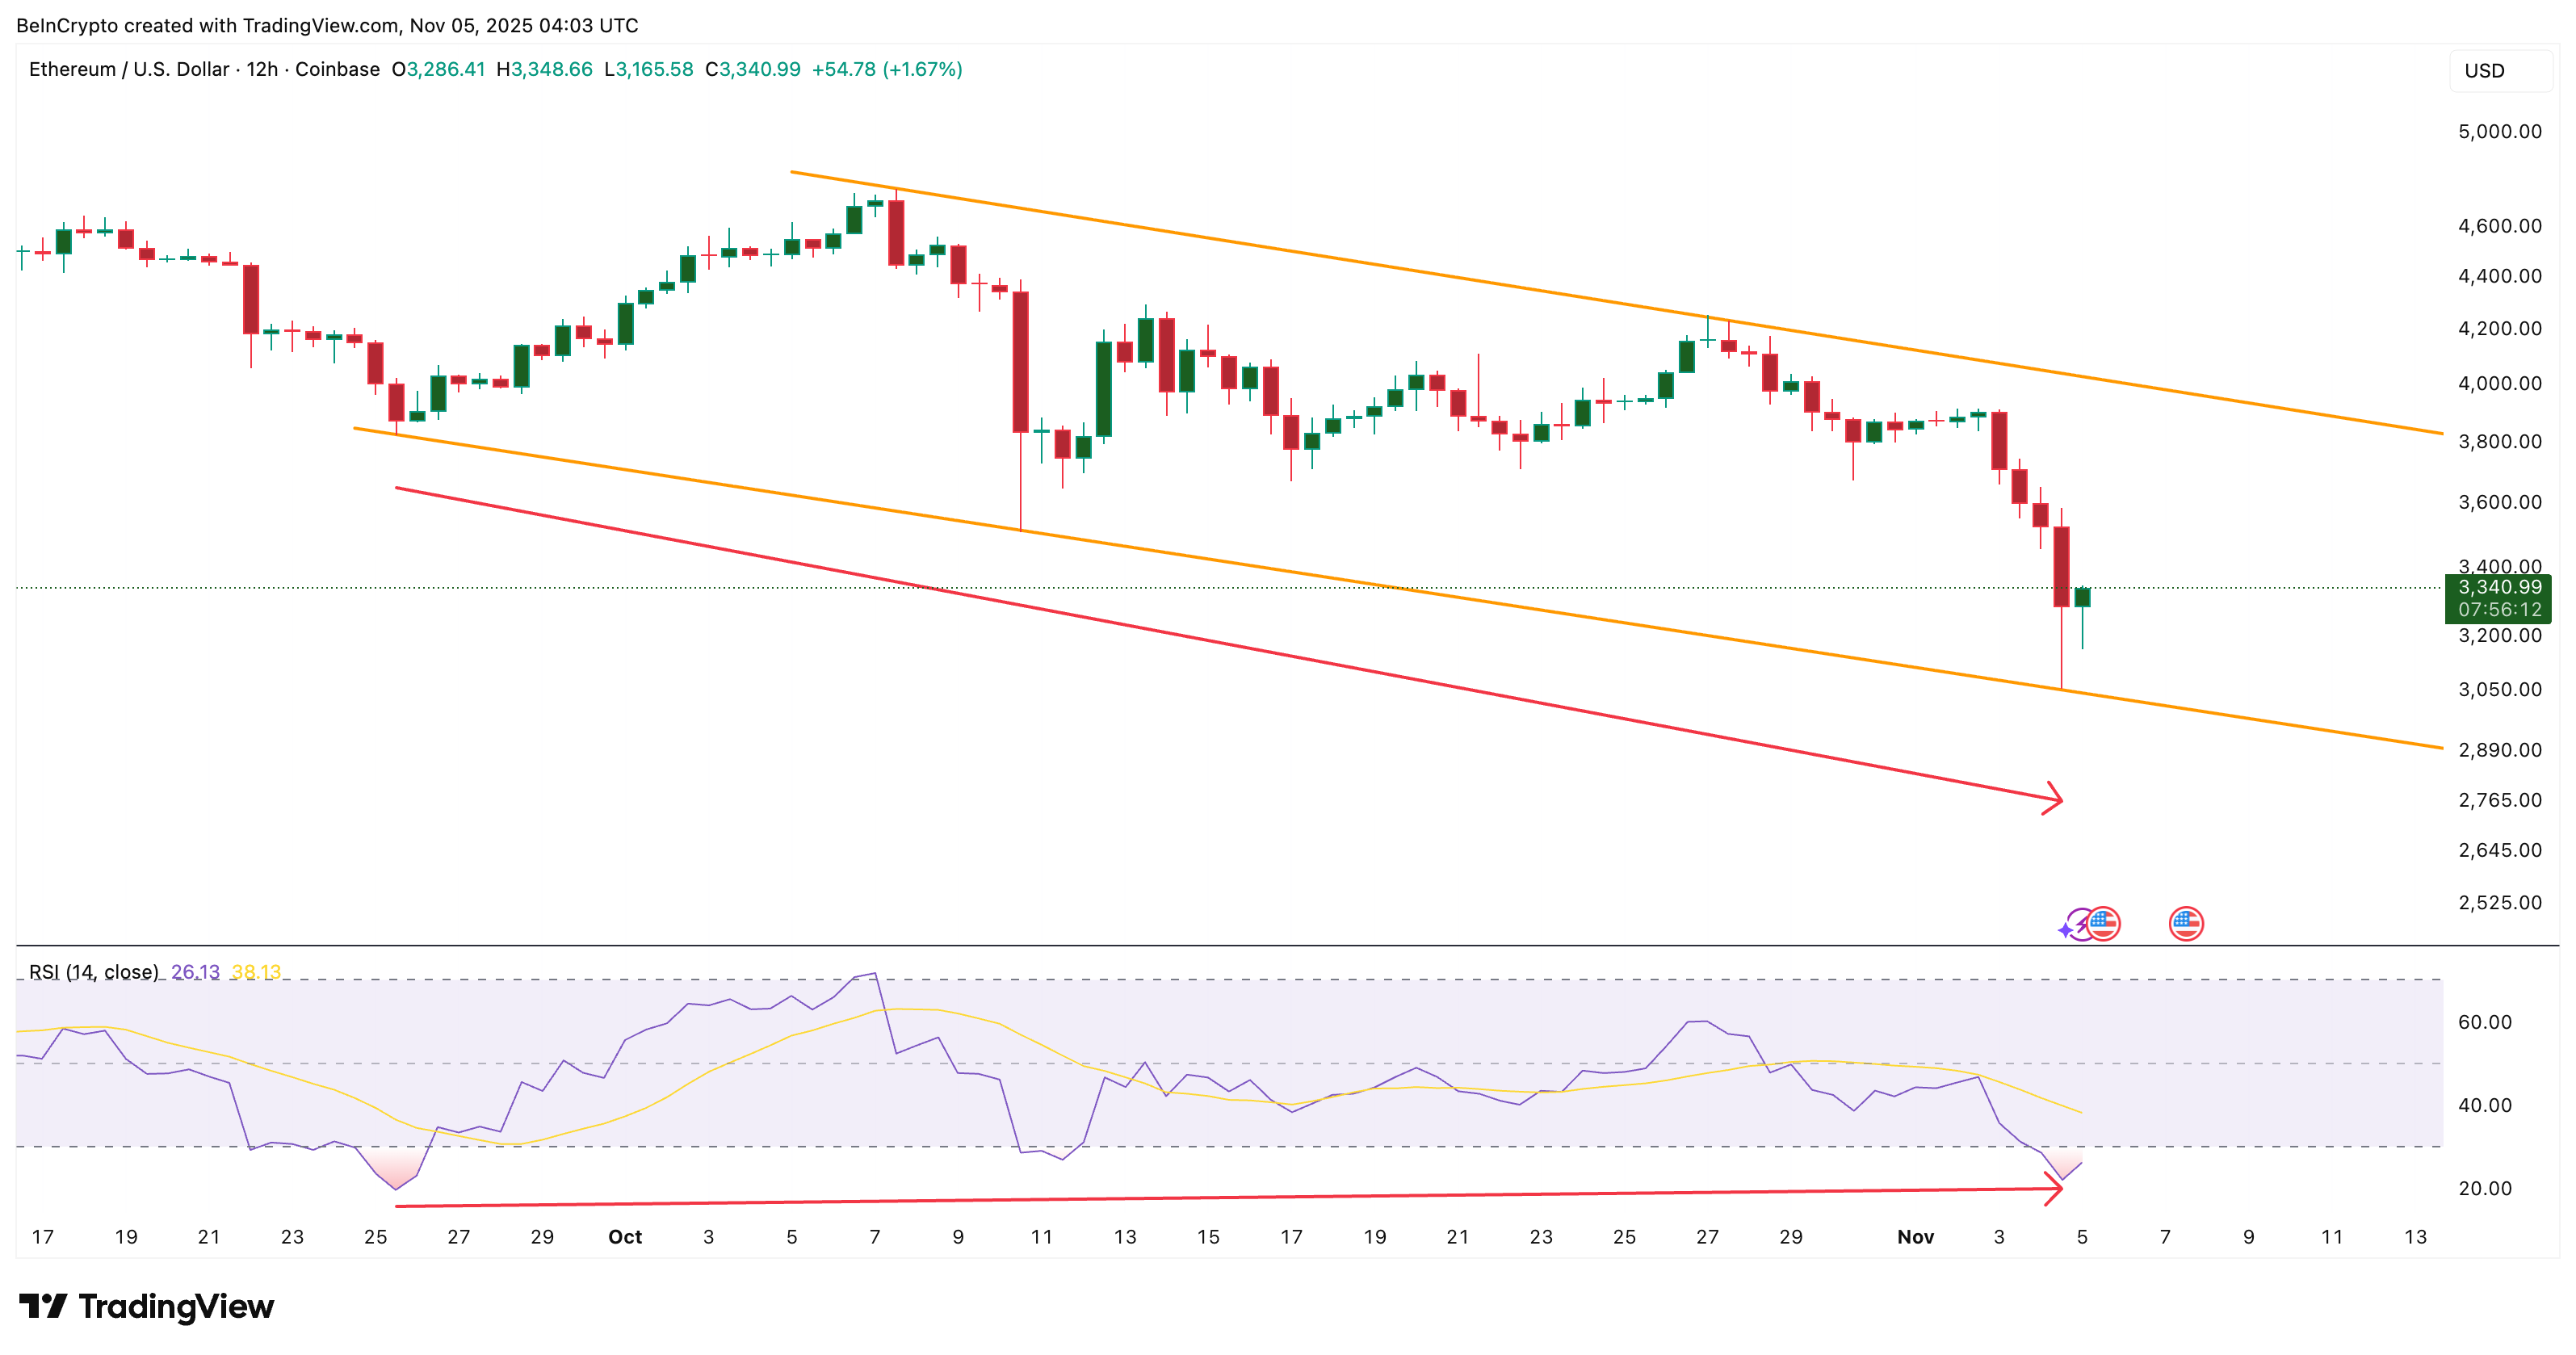
Ethereum flashes bullish divergence: TradingView
Want more token insights like this? Sign up for editor Harsh Notariya’s daily crypto newsletter here.
This pattern is known as a bullish divergence and usually indicates that selling pressure is waning and a trend reversal or rebound is likely to follow.
Since hitting a low of $3,053, Ethereum price has already increased by 9% at the time of writing. That could mean the beginning of a rebound. But it’s still too early to say.
Large wallet holders are quietly starting to return in favor of this setup. The Ethereum whale increased its total holdings from 101.05 million to 101.09 million ETH in just a few hours, adding approximately 0.04 million ETH, or $134 million at current prices.
This is not an aggressive buildup, but it does signal a renewed sense of confidence after a sharp decline.
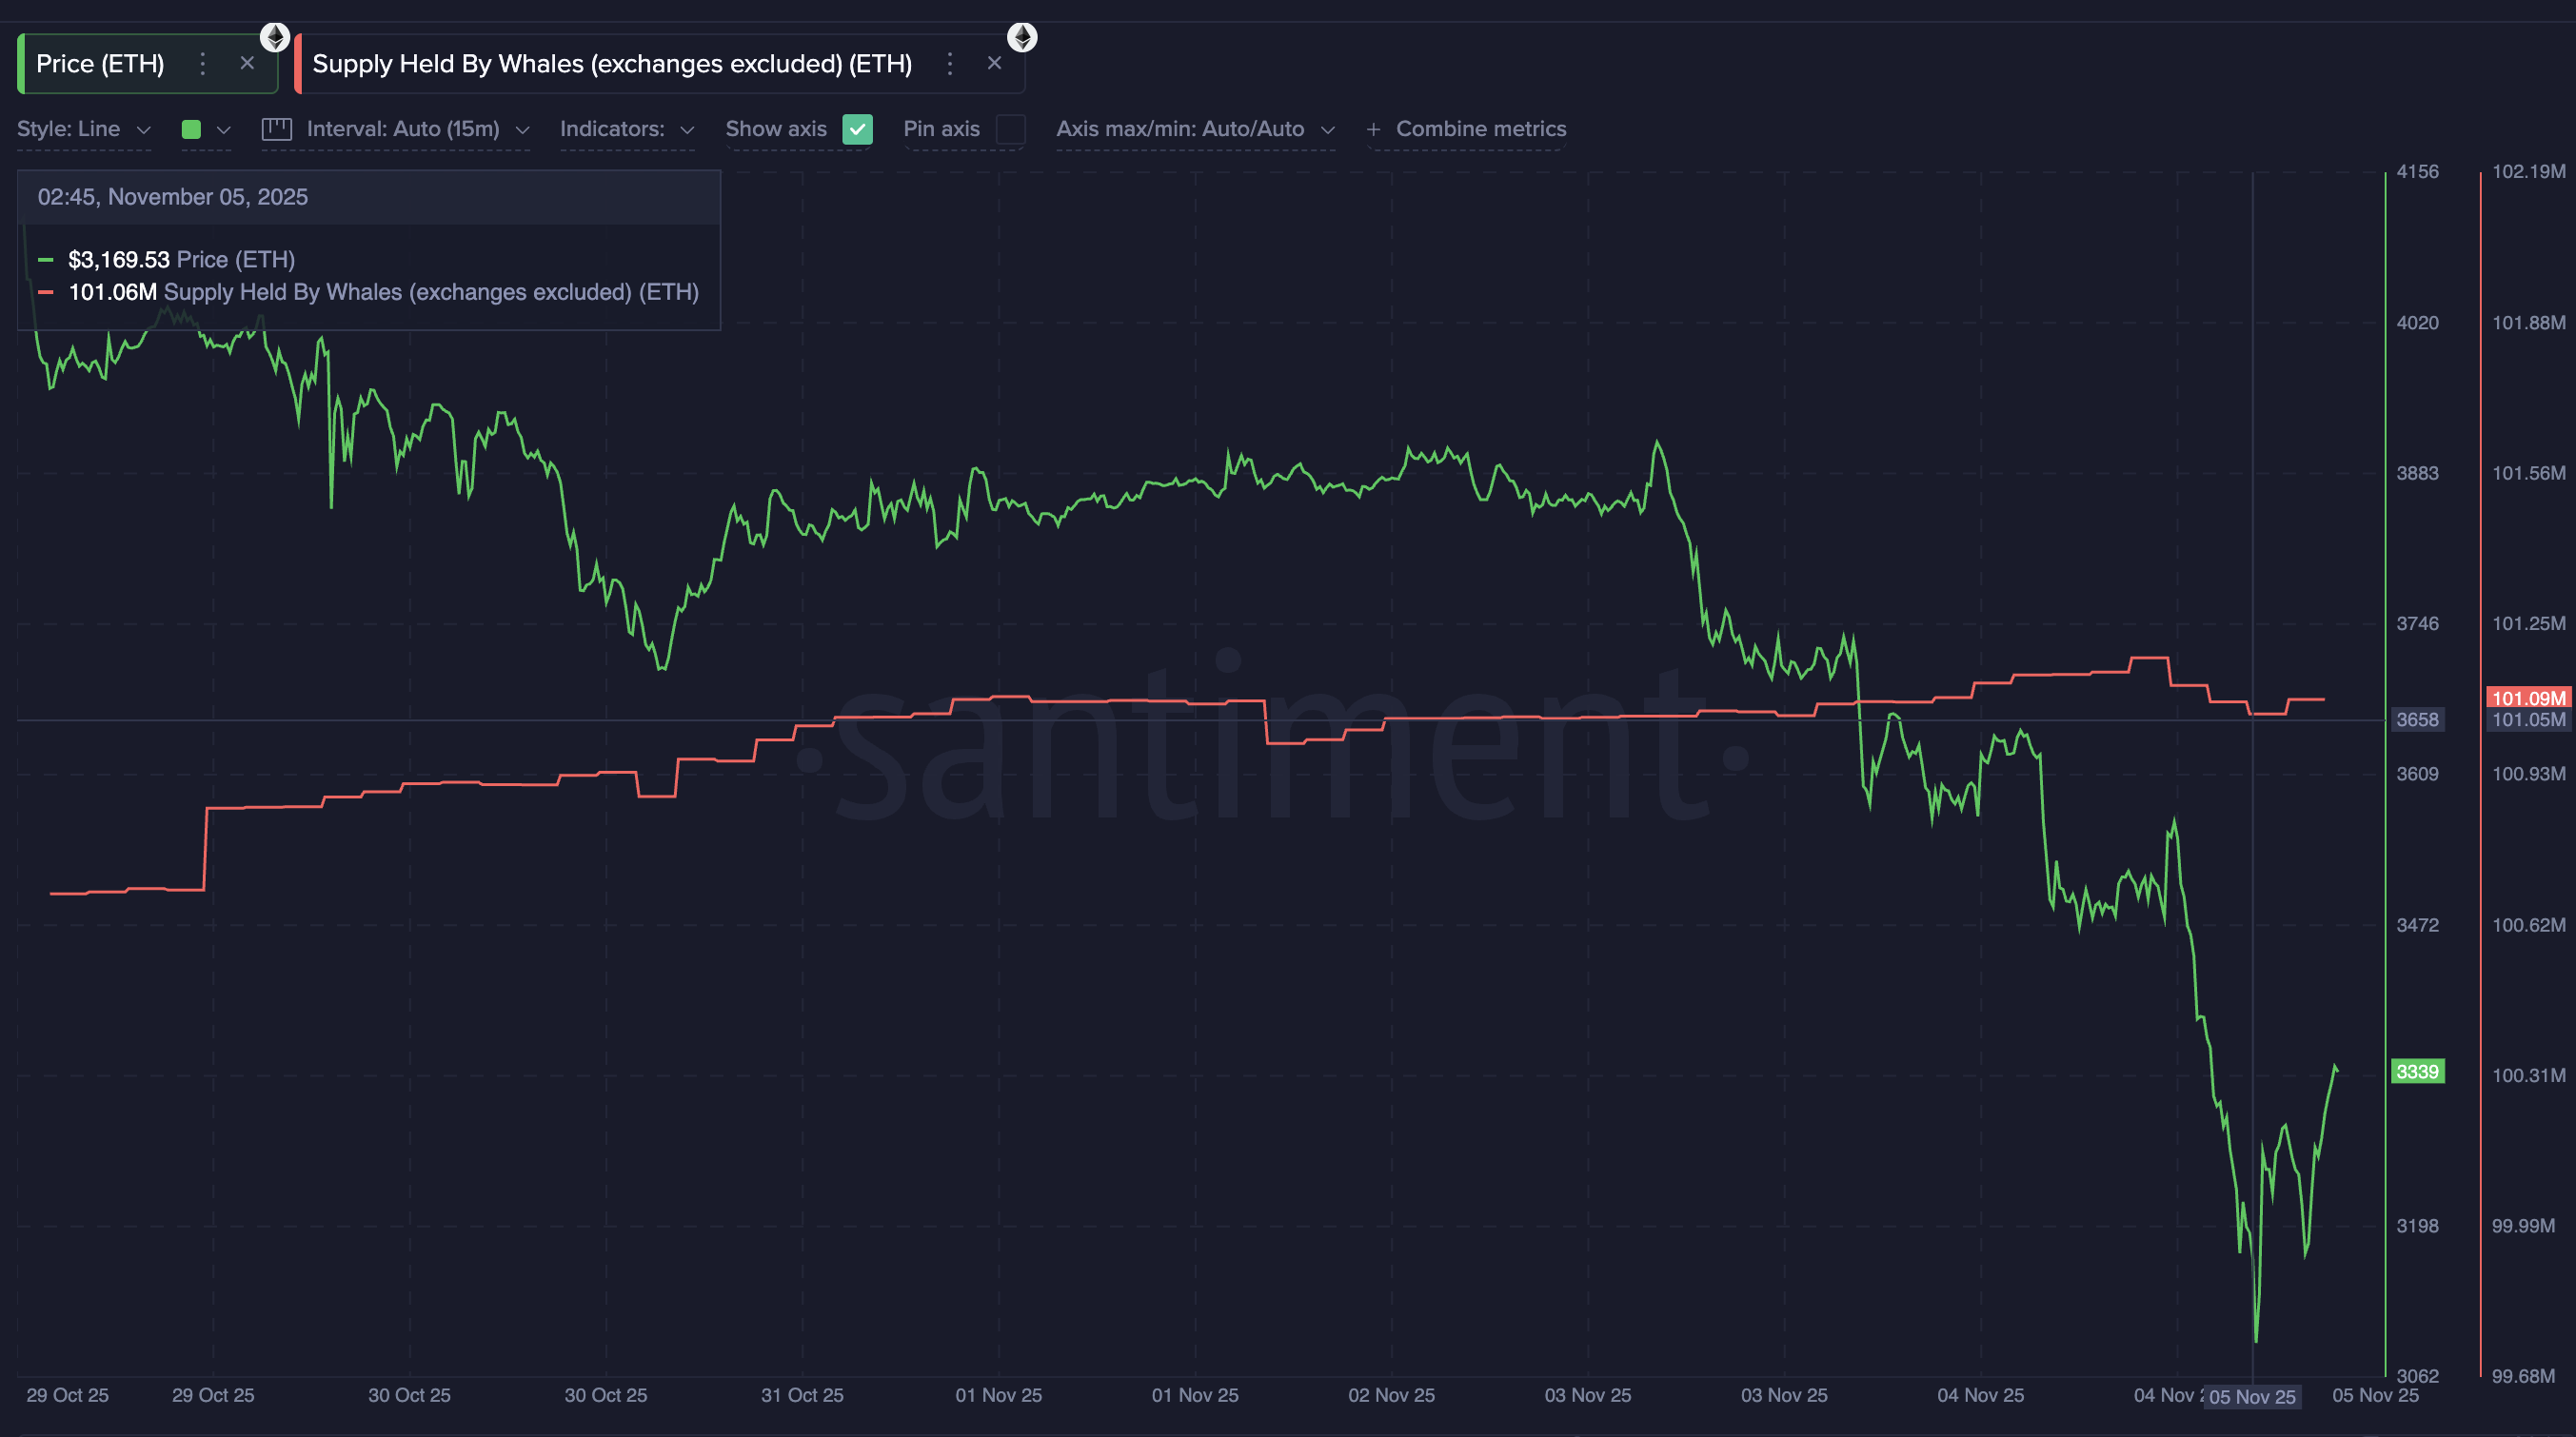
The Ethereum whale is emerging: Santiment
Meanwhile, the net unrealized profit or loss (NUPL) ratio, which measures how much profit or loss investors still have, fell to 0.27, the lowest level since July 7. When NUPL falls this low, it often means that most of the weaker hands have exited at a loss, leaving the more determined holders behind.
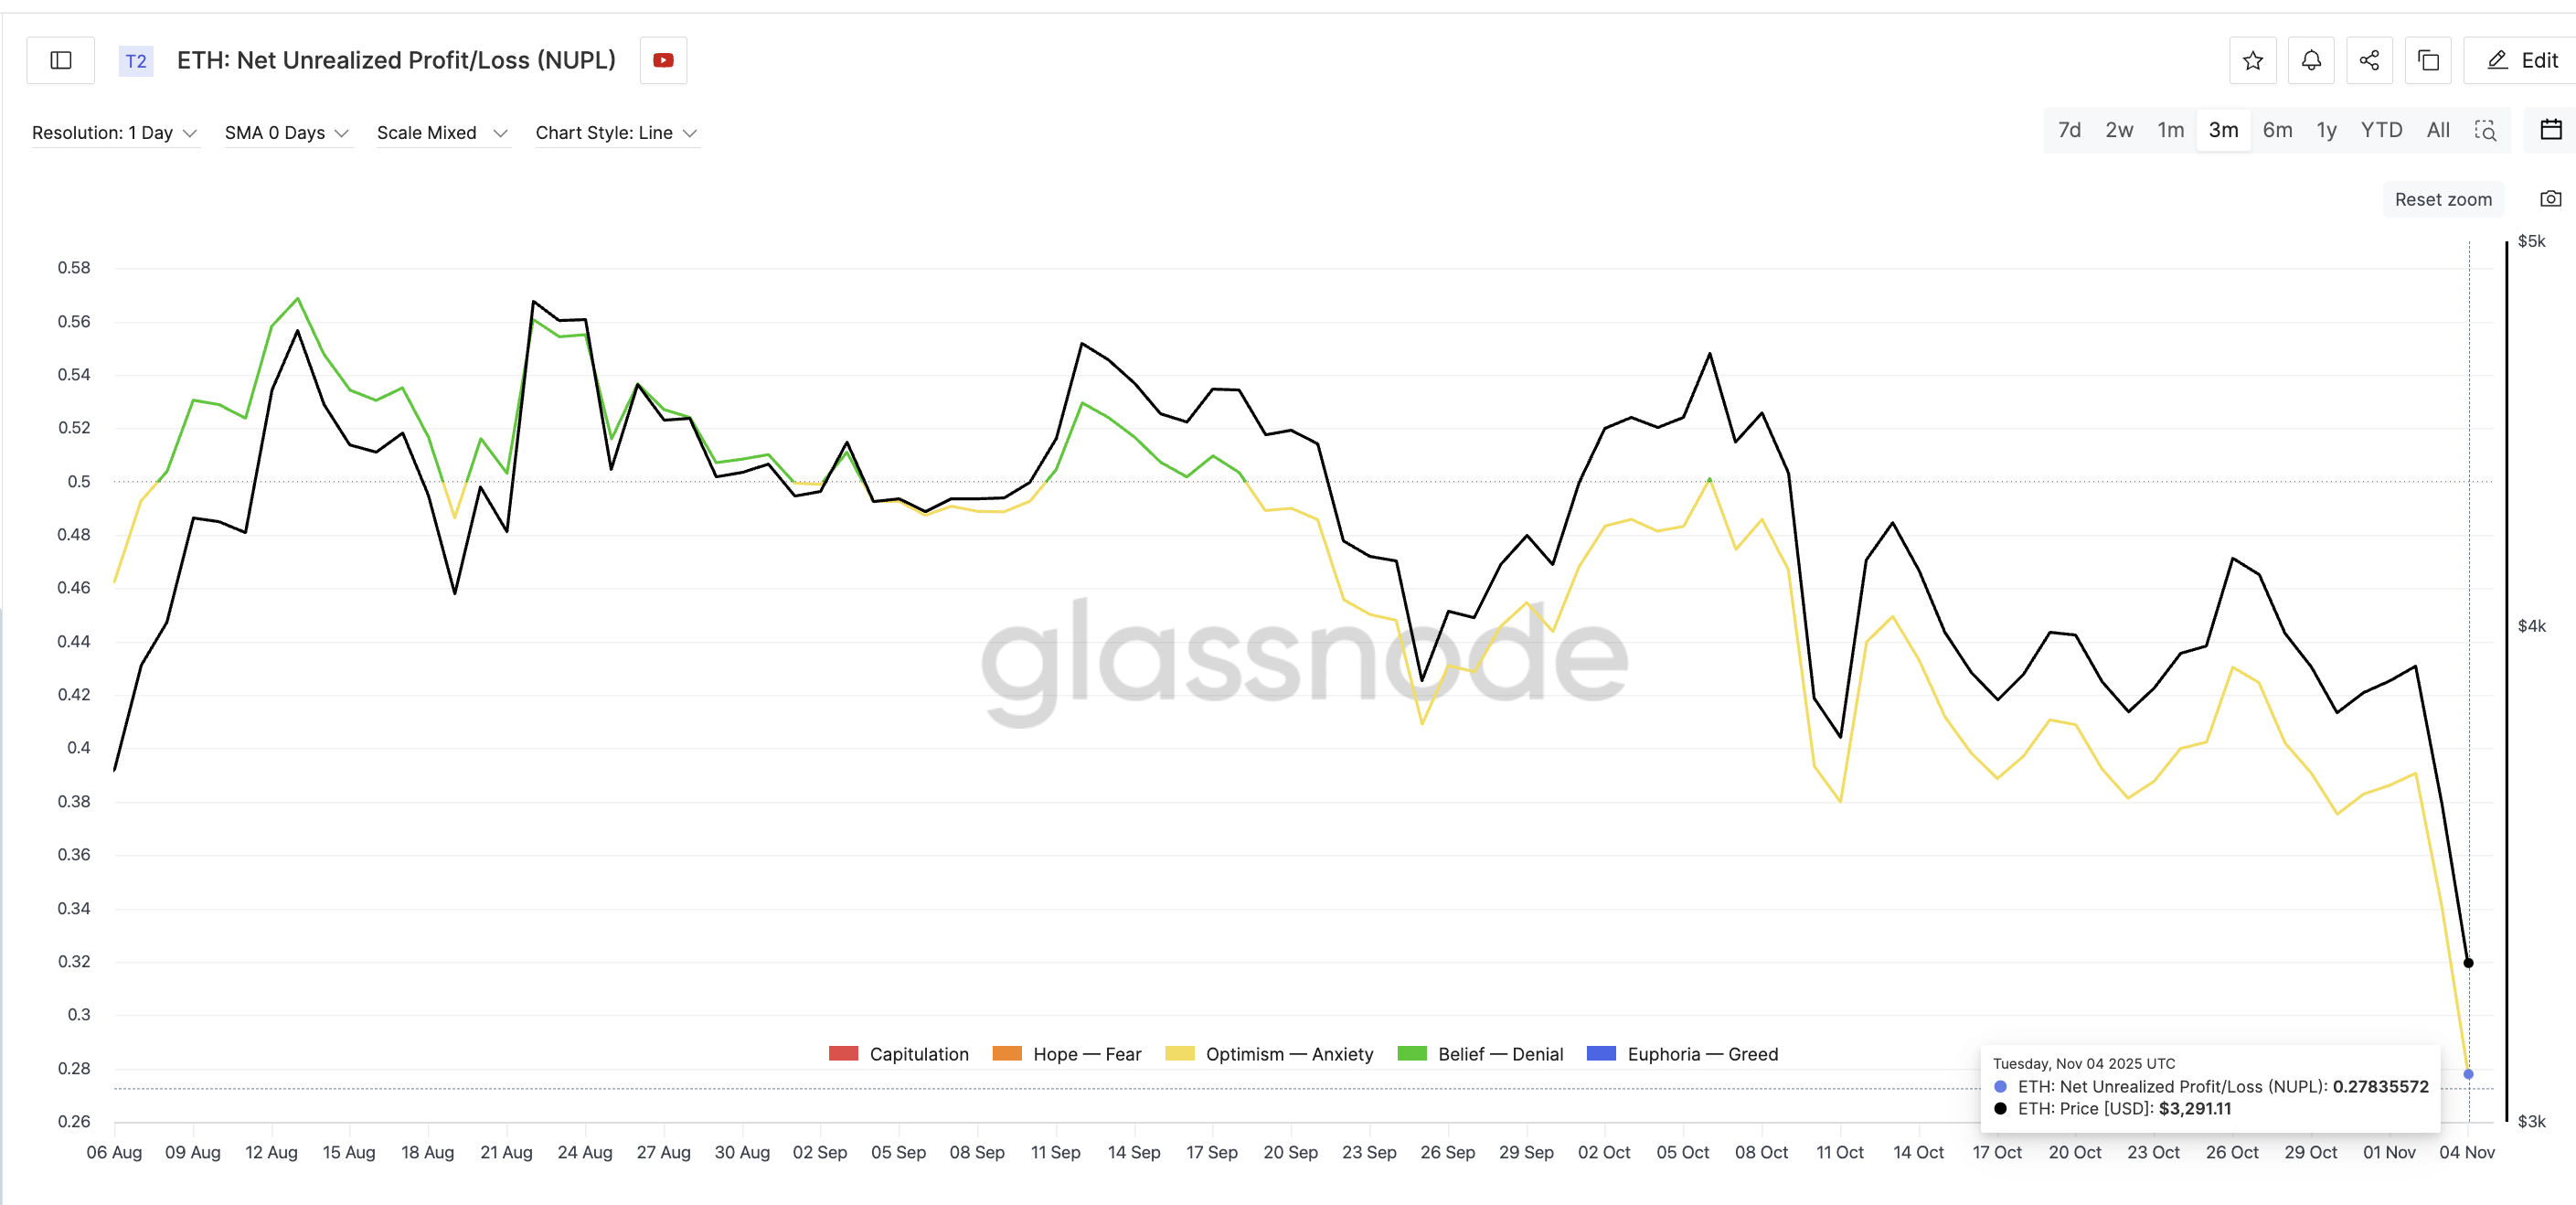
Weak hands are mostly out: Glassnode
The last time this indicator fell, forming a local bottom in mid-October, Ethereum rallied more than 10% within two sessions, suggesting the market may be repeating this move.
Derivatives data shows increasing pressure on short-term Ethereum price squeeze
The Ethereum derivatives market also supports the possibility of a rebound. According to Bybit’s ETH/USDT liquidation map, nearly $1.2 billion of short positions are currently at risk between $3,320 and $3,740.
This is a huge amount compared to just $330 million in long leverage. This imbalance (approximately 3.5 times the number of shorts than longs) suggests that any upside movement could cause a short squeeze, forcing short traders to buy back and accelerating price appreciation.
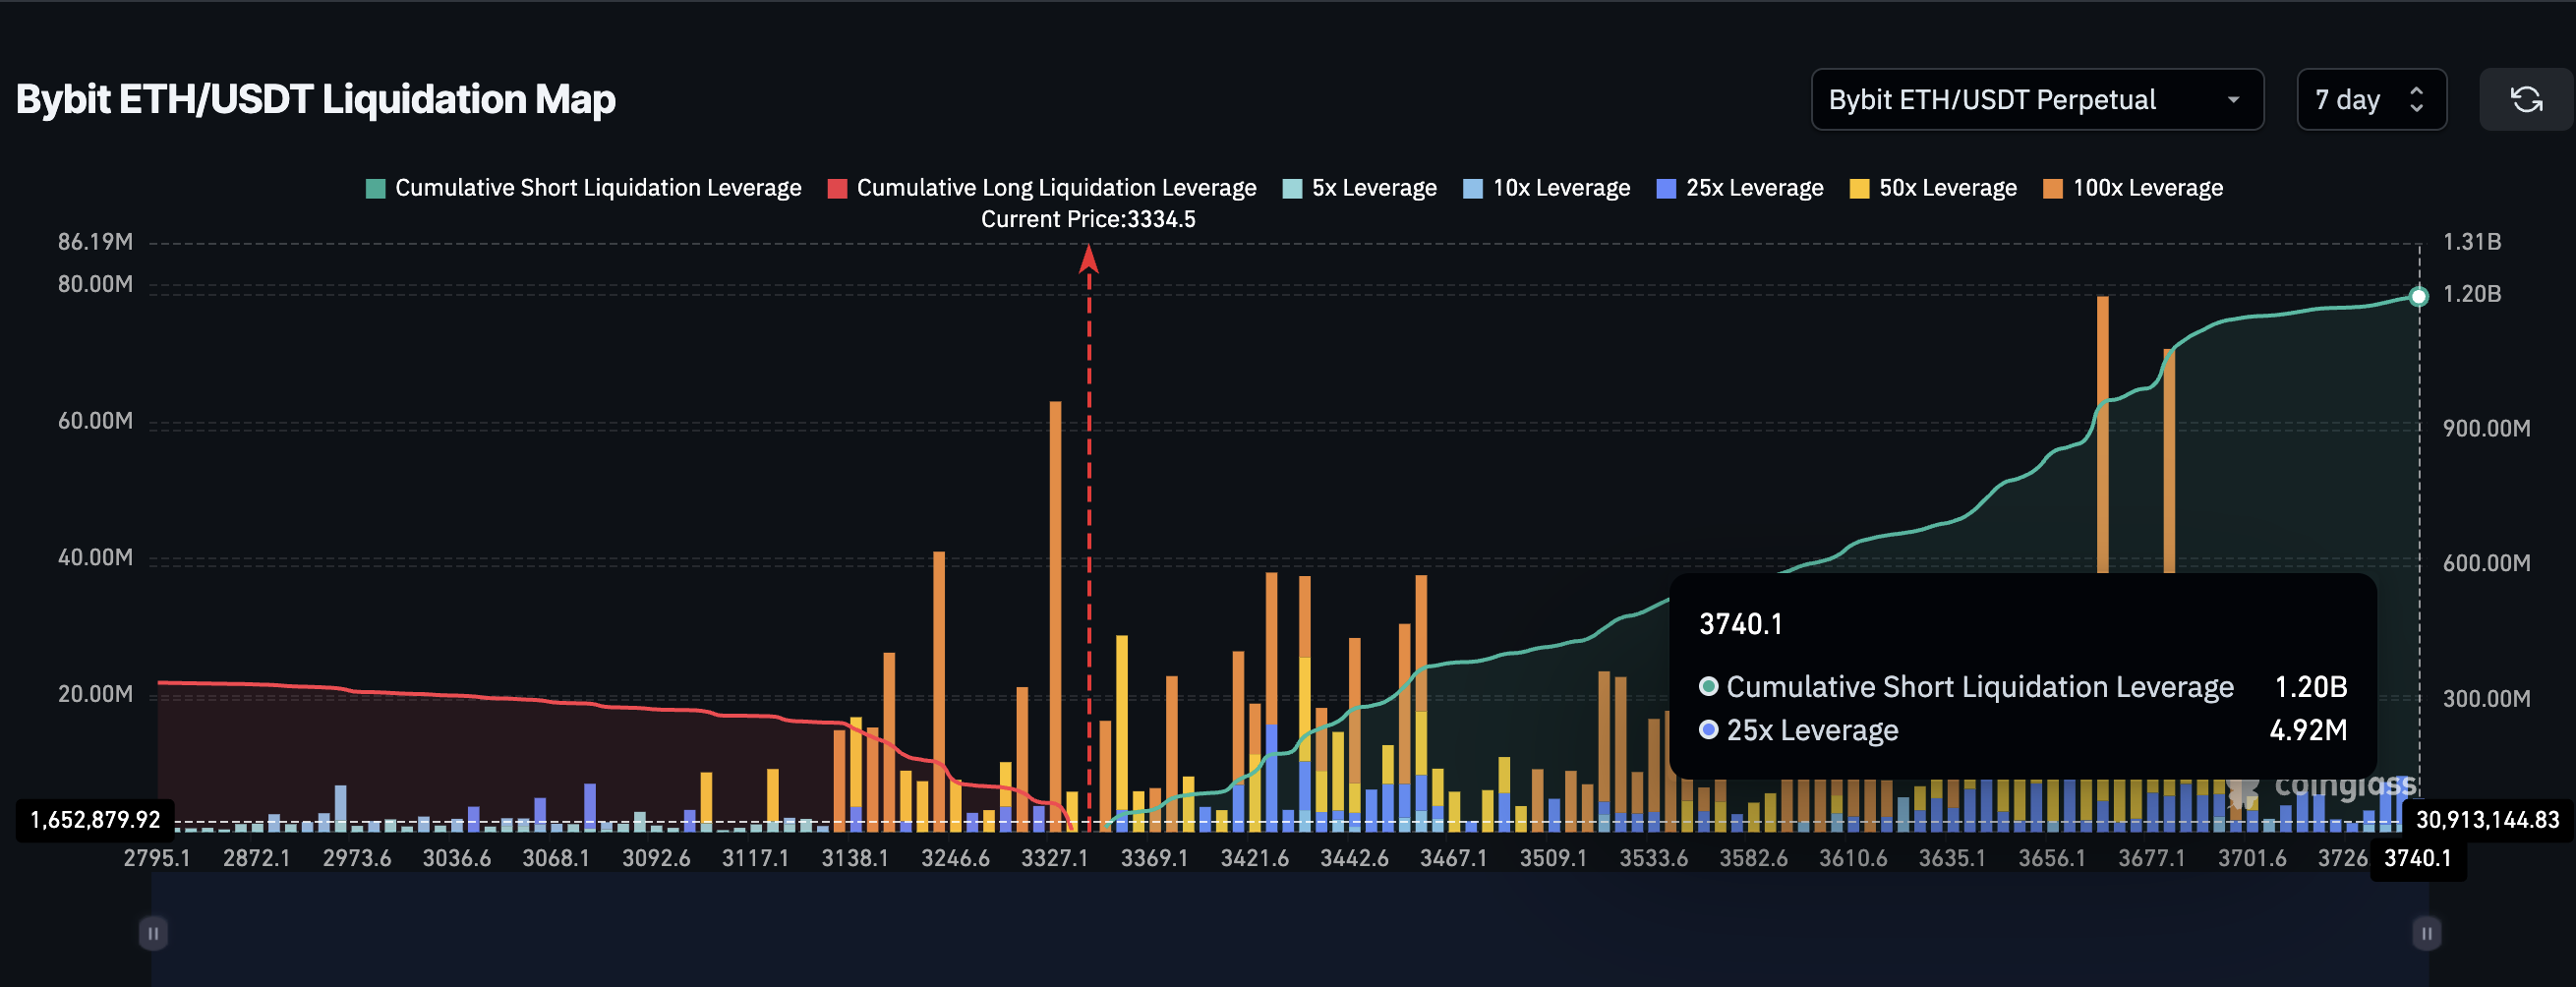
Liquidation Map Suggests Short Squeeze Setup: Coin Glass
However, if Ethereum falls again, some sizable long positions around $3,100 could be wiped out. This is one of the risk factors that traders must monitor carefully.
Technically, Ethereum continues to move within a descending channel, confirming that the overall trend is still bearish. However, the key support zone at $3,053 has held so far.
If Ethereum can close above $3,338, a rebound setup will be confirmed. The next major resistance level from there is around $3,799.
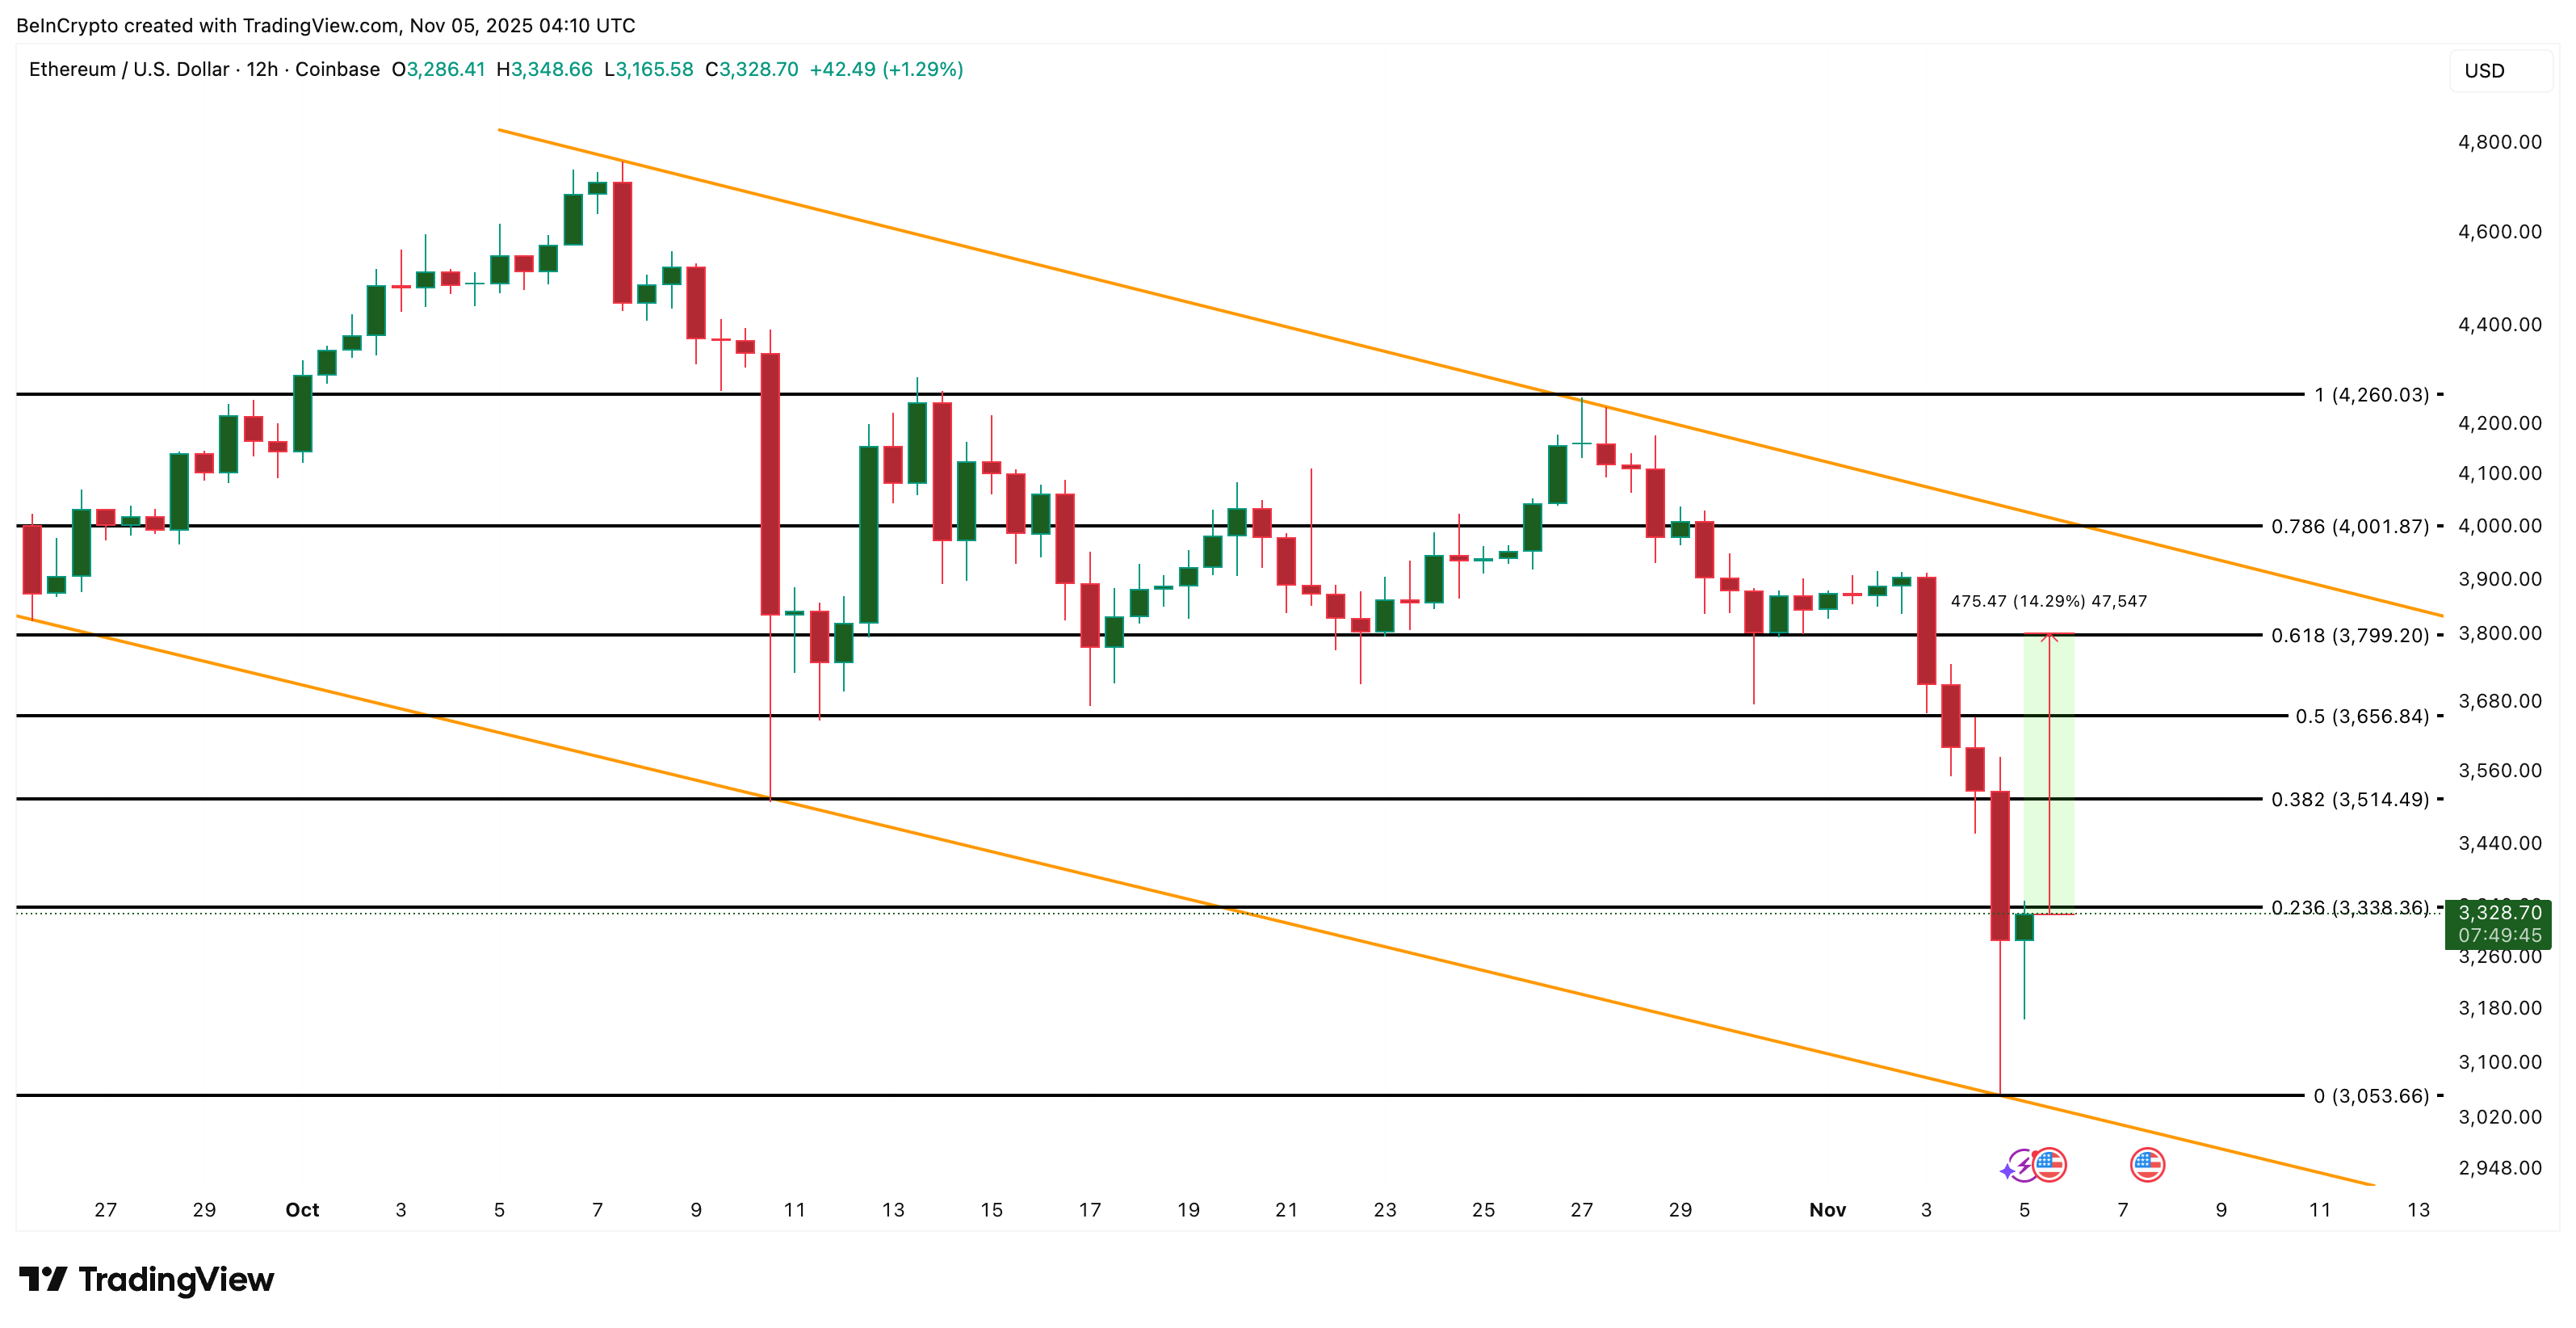
Ethereum Price Analysis: TradingView
Clearing it with a 14% rally could trigger an even stronger move towards $4,000 and even $4,260. However, if the 12-hour candlestick closes below $3,053, Ethereum price will invalidate the rebound hypothesis.
The article “Ethereum may have hit the bottom — rebound settings point to $4,000 target” was first published on BeInCrypto.