
Ethereum is showing tentative signs of relief after weeks of downward pressure, but the recovery remains fragile. The price is currently struggling to clearly break above the $3,400 level, which has repeatedly served as resistance during recent bounce attempts. Although near-term sentiment has improved with broad market stabilization, risks remain high. Several analysts warn that Ethereum could face further declines in the coming weeks if momentum weakens and macro or liquidity conditions deteriorate again.
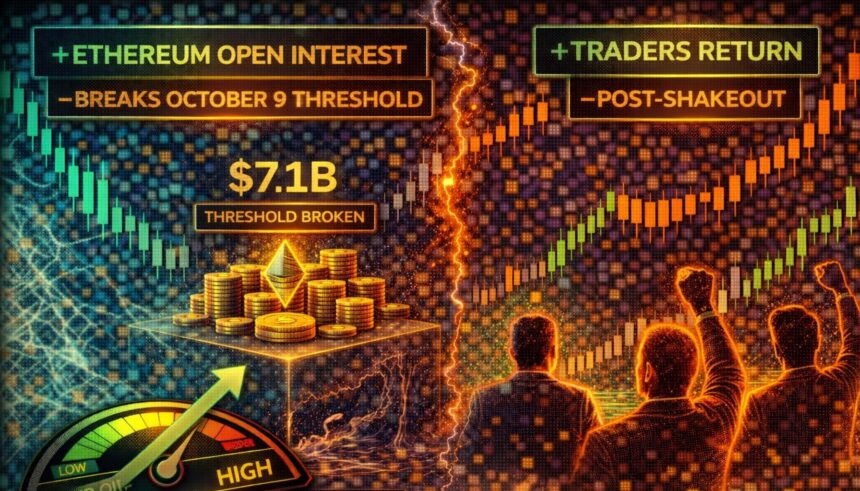
To further complicate the situation, derivatives data suggests risks are increasing again. Arab Chain’s report highlights that Ethereum’s open interest on Binance has grown to around $8.6 billion, the highest level since October 9.

This is a notable change after a prolonged period of contraction following a sharp liquidation event in October that saw open interest collapse from more than $10 billion to less than $7 billion in a matter of days. This event removed excessive leverage from the market and forced traders to take a defensive stance.
The current increase in open interest is a sign that traders are returning and reorganizing their positions at increasingly lower price levels. But this also price sensitivity To sudden movements.
Ethereum is currently testing a key structural resistance area around $3,400, and the latest derivatives data adds important context to this price action. According to Arab Chain’s CryptoQuant report, the increase in open interest on Binance reflects new activity in the derivatives market and a clear return to traders’ appetite for leverage. This is a notable change from the defensive posture that emerged after the October liquidation wave.
What is noticeable is that the increase in open interest is occurring while ETH is trading near $3,300-$3,400, well below previous cycle highs. This means that traders are not chasing extreme prices, but rather building positions at relatively discounted levels. Historically, this type of positioning often reflects expectations of medium-term upside rather than short-term speculation.
At the same time, the fact that open interest has reached its highest level since October 9 rather than returning to previous heated extremes suggests a more balanced recovery. If this growth is driven by steady inflows rather than aggressive leverage, this supports the idea of a healthier market structure forming after the post-liquidation contraction phase.
However, near resistance the risks remain asymmetric. A sustained and rapid expansion of open interest while the price remains stagnant below $3,400 could increase vulnerability to rapid volatility. For Ethereum to maintain momentum, price and open interest must match, confirming that confidence is being rebuilt rather than overstretched.
Ethereum price action on the daily chart shows that the market is trying to recover but is still constrained by heavy structural resistance near the $3,400 region. ETH set a local low below $2,900 after a sharp decline from the October high and has since formed higher lows, suggesting a near-term stabilization rather than a confirmed trend reversal.

The price is currently trading near $3,300, where several technical factors are converging. The falling 200-day moving average and the transition from previously horizontal support to resistance are limiting upward momentum. Each rally into this zone has been met with selling pressure, highlighting that this zone remains an important supply area. The inability to recover $3,400 crucially keeps the broader structure from neutral to bearish.
The downside is that rising short-term moving averages and recent higher lows around $3,000-$3,050 provide initial support. As long as ETH remains above this range, the market will maintain a constructive consolidation structure rather than resuming its previous impulsive downtrend. Trading volume remained moderate throughout the recovery, indicating controlled participation rather than aggressive speculative buying.
ETH is under pressure between rising short-term support and falling long-term resistance. This type of price action often precedes a directional move. A clean daily close above $3,400 would signal a change in market control and open the door to a broader recovery.
Featured image from ChatGPT, chart from TradingView.com
editing process for focuses on providing thoroughly researched, accurate, and unbiased content. We adhere to strict sourcing standards, and each page is diligently reviewed by our team of top technology experts and seasoned editors. This process ensures the integrity, relevance, and value of the content for readers.