Ethereum price adjusts after explosive rise
of $Ethereum price A slight recoil was seen around 4% After a strong rally that pushed ETH up, From around $2,900 to highs around $3,300. After several steady upswing sessions, the market is now showing signs of short-term depletion, with traders taking profits near key resistance zones.
This correction comes on the heels of a downward correction in Bitcoin prices, suggesting that the move is more serious. technical adjustments than a change in trends.
Ethereum Analysis: Key Levels from Charts
Looking at the 4-hour chart, Ethereum faced Repeated rejections near the $3,200-$3,300 zonea level that previously acted as resistance in December. The chart has shown similar price movements before, with ETH struggling in this range and then withdrawing.
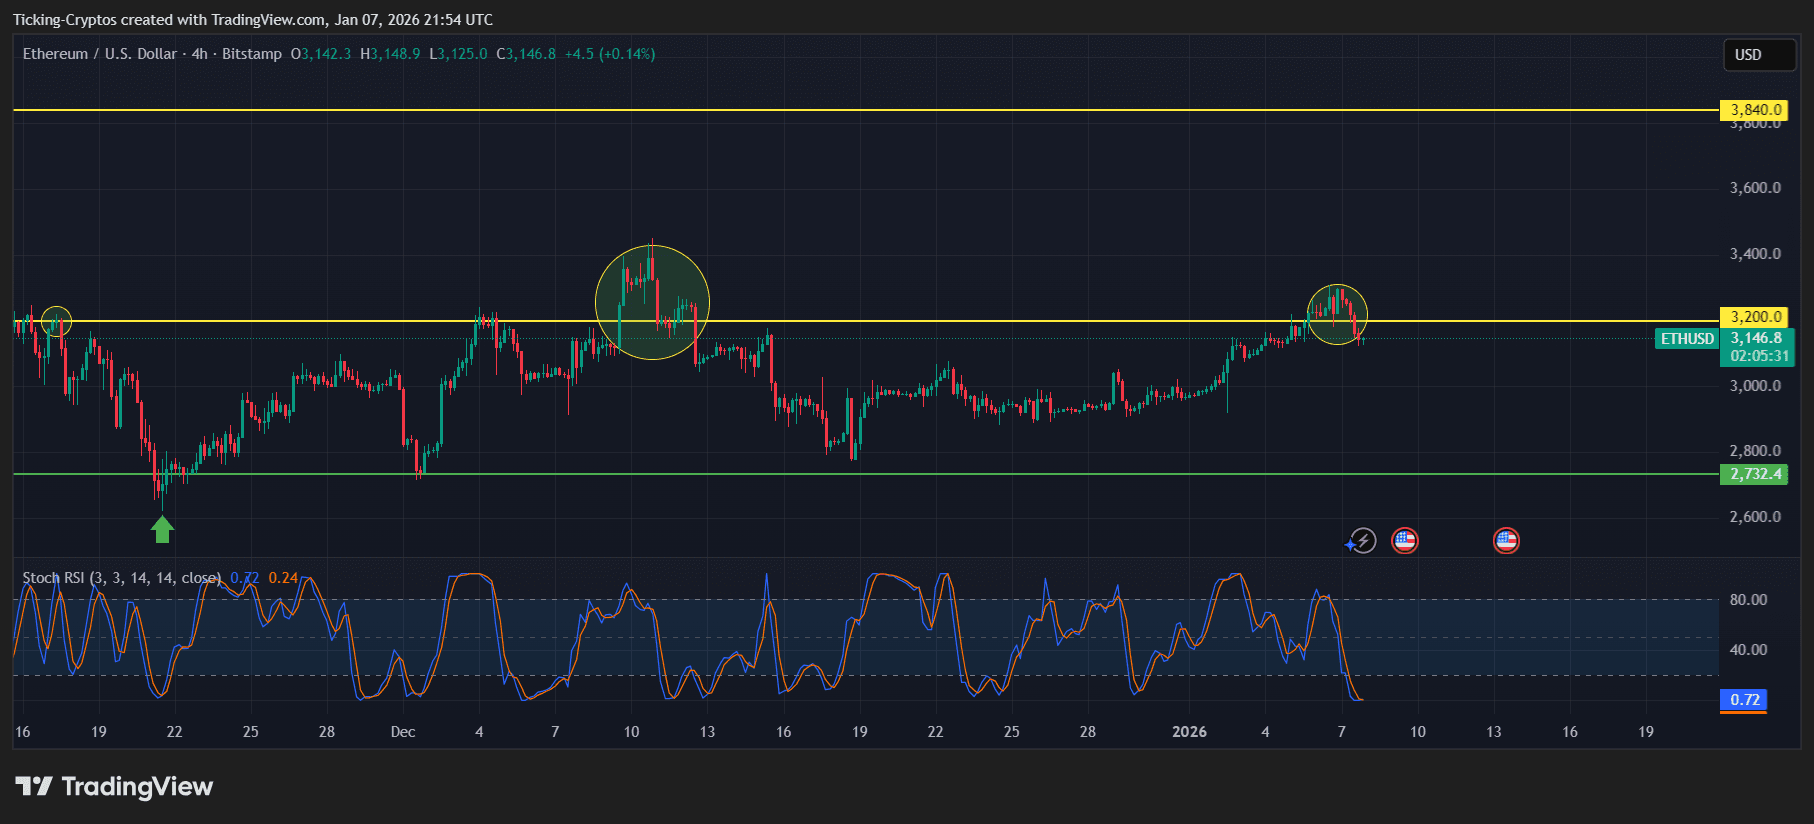
ETH/USD 4 hours – TradingView
As a disadvantage, $3,050–$3,100 It is emerging as important short-term support. A more serious correction could cause ETH to reconsider. $2,900 areawhich coincides with a strong demand zone and previous breakout levels.
of Stochastic RSI It is resetting from an overbought condition and is often the basis for a consolidation rather than a complete trend reversal.
Ethereum price prediction after the crash
If Ethereum maintains the above $3,000the structure remains bullish. A period of sideways consolidation may allow momentum to rebuild before attempting to break out again. $3,300. If a breakout above that level is confirmed, the door will open for a move towards it. $3,600 – $3,800 In the coming weeks.
However, the decline continues below $2,900 The bullish setup could weaken and trigger a deeper retracement.
For now, the Ethereum rebound looks like this: A healthy pause after a strong climbthe broad trend continues to support upside as long as key support levels hold.