
Ethereum price started a decent rise but failed around $3,050. ETH is currently struggling and could continue to fall below $2,900.
- Ethereum started a wave of recovery but struggled once it broke above $3,000.
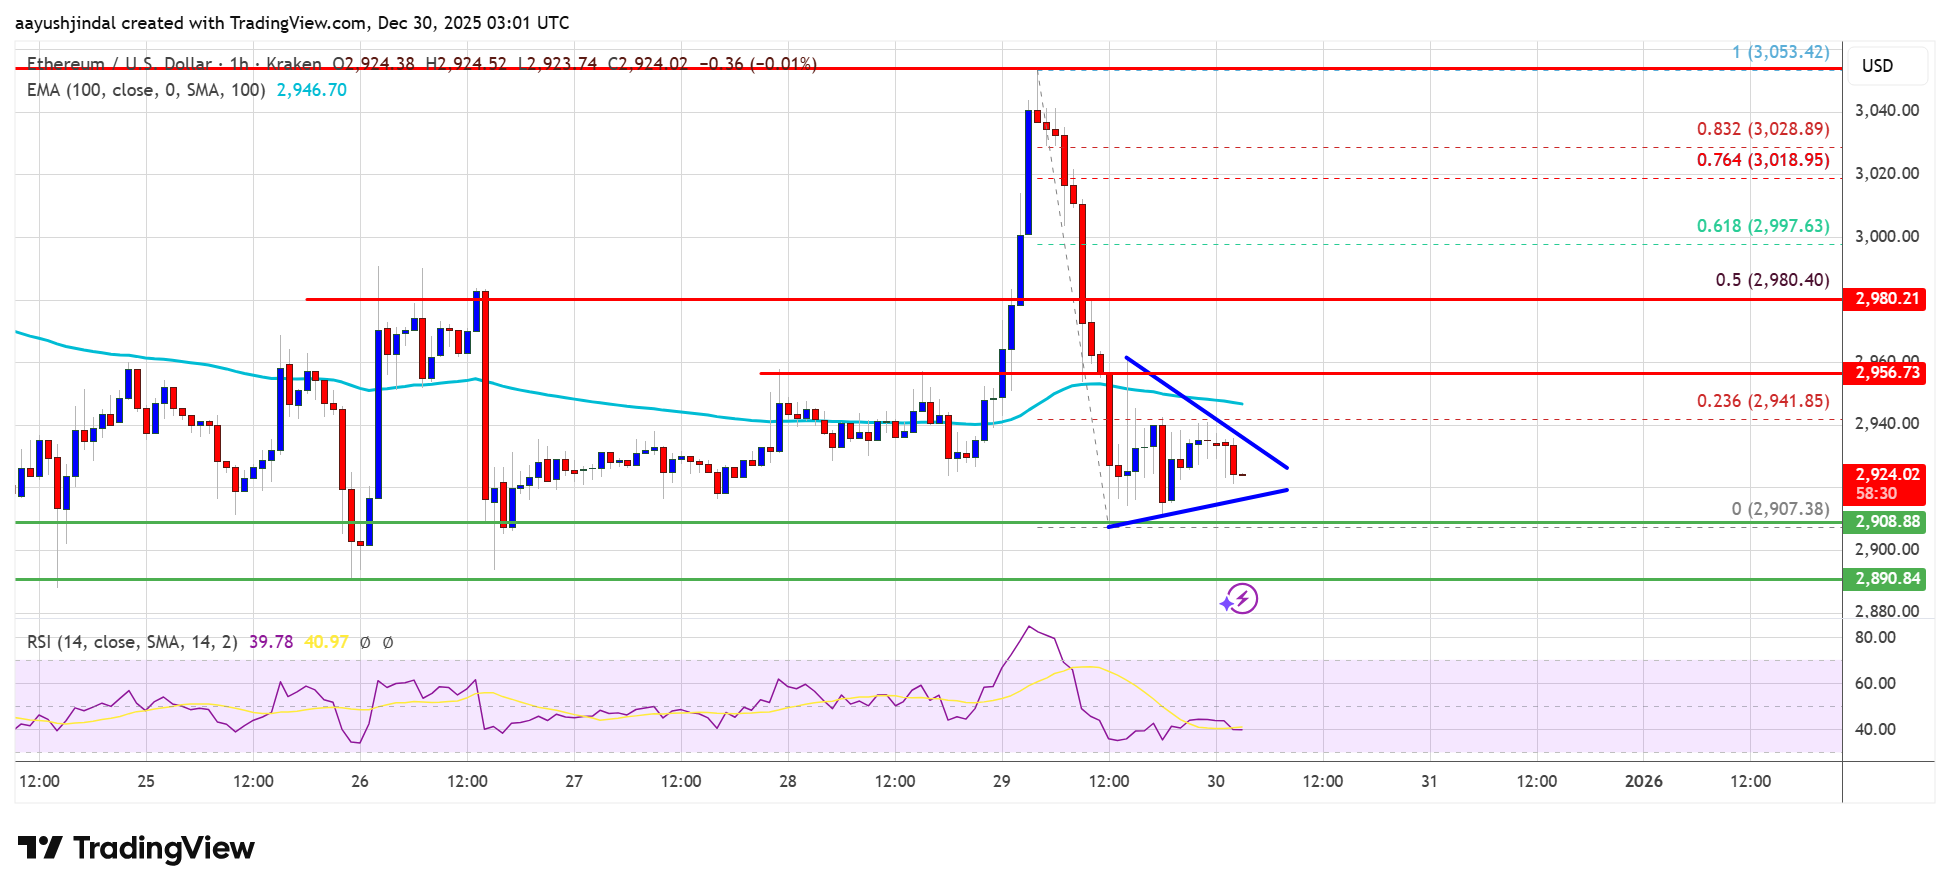
- The price is trading below the 100-hour simple moving average at $2,950.
- On the hourly chart of ETH/USD (data feed via Kraken), there is a short-term contraction triangle forming with resistance at $2,930.
- If it breaks below the $2,880 zone, the pair could continue to fall.
Ethereum price falls again
Ethereum price, similar to Bitcoin, has started a wave of recovery above the $2,920 and $2,950 levels. ETH price even rose above the $3,000 resistance before the bears emerged.
A high was formed at $3,053 and the price began to fall again. There was a sharp decline below $3,000 and $2,980. The bears pushed the price below $2,950. A low was formed at $2,907 and the price is currently consolidating losses below the 23.6% Fib retracement level of the decline from the swing high of $3,053 to the low of $2,907.
Ethereum price is currently trading above $2,950 and its 100-hour simple moving average. If the bulls can prevent further losses below $2,900, the price could attempt another wave of recovery.
Immediate resistance is seen near $2,940. Additionally, on the hourly chart of ETH/USD, a short-term contracting triangle has formed with resistance at $2,930. The first major resistance level is near the $2,955 level. The next major resistance level is near the $2,980 level. This is close to the 50% Fib retracement level of the decline from the swing high of $3,053 to the low of $2,907.
A clear break above the $2,950 resistance could push the price towards the $3,000 resistance. A break above the $3,000 area could lead to further gains in the coming days. In the above case, Ether could rise towards the $3,050 resistance zone and even $3,120 in the short term.
Will ETH fall again?
If Ethereum fails to break through the $2,955 resistance level, a fresh decline could begin. Initial support on the downside is near the $2,900 level.
The first major support is located near the $2,880 zone. A clear move below the $2,880 support could push the price towards the $2,840 support. Any further losses could send the price towards the $2,800 area. The next significant support is $2,720.
technical indicators
Hourly MACD – ETH/USD MACD is gaining momentum in the bearish zone.
hourly RSI – The RSI for ETH/USD is currently below the 50 zone.
Major Support Level – $2,900
Major Resistance Level – $2,955