Bitcoin traded near me $72,386 at time of writingup about 2.5% over the past seven days. The short-term recovery has sparked cautious optimism among some traders. But some continue to warn that the market may not have reached its final bottom yet.
Why be concerned? Analysts note that the current chart structure pattern closely resembles the fractals seen during the period. Cryptocurrency bear market in 2022. This historical pattern evolved through several stages before prices plummeted.
Some observers now believe that Bitcoin has already completed the third stage of its pattern. If the fractal continues, the market may fall further. This possibility raises important questions across trading desks. The question is, “Is this recovery temporary?”
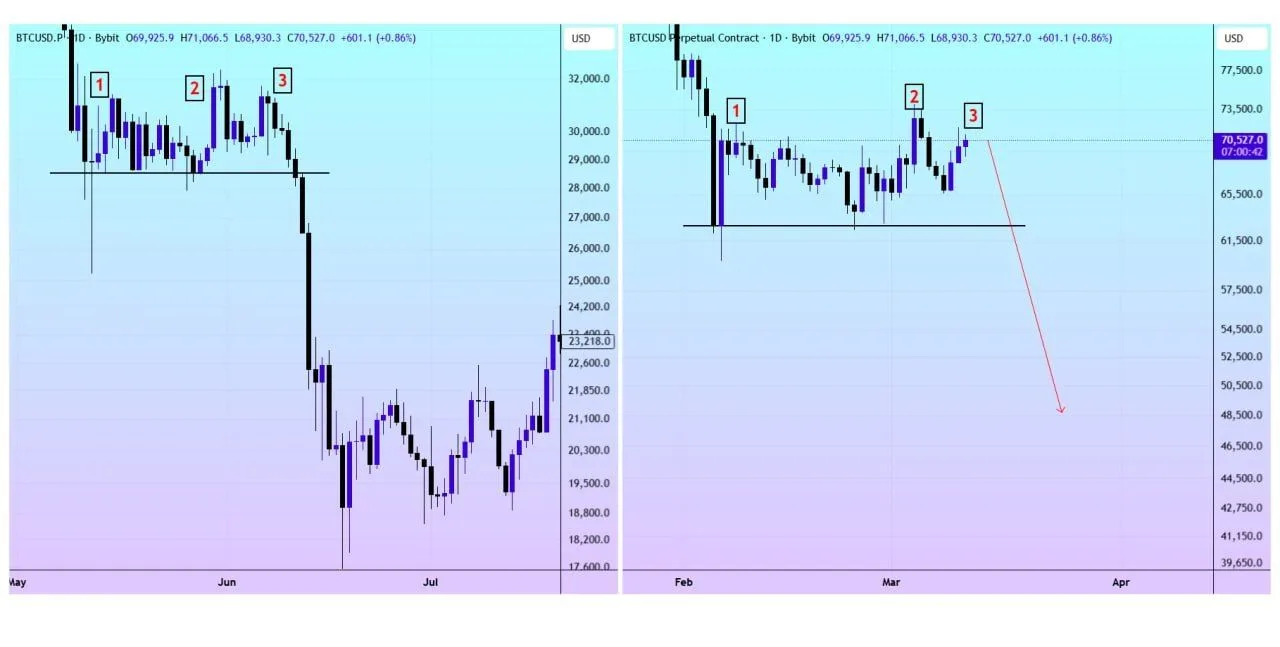
Source: TradingView
Signs of weakness in global markets
Bitcoin rarely moves on its own. The broader financial environment often influences crypto sentiment, and cracks are beginning to appear in some traditional markets.
Major US indexes closed sharply lower in recent trading. The Dow Jones Industrial Average fell more than 739 points, or 1.56%. The Nasdaq 100 fell 1.73% and the S&P 500 fell about 1.52%. These declines reflect a broader risk-off mood in financial markets. As investors reduce their exposure to equities, cryptocurrencies often come under similar pressure.
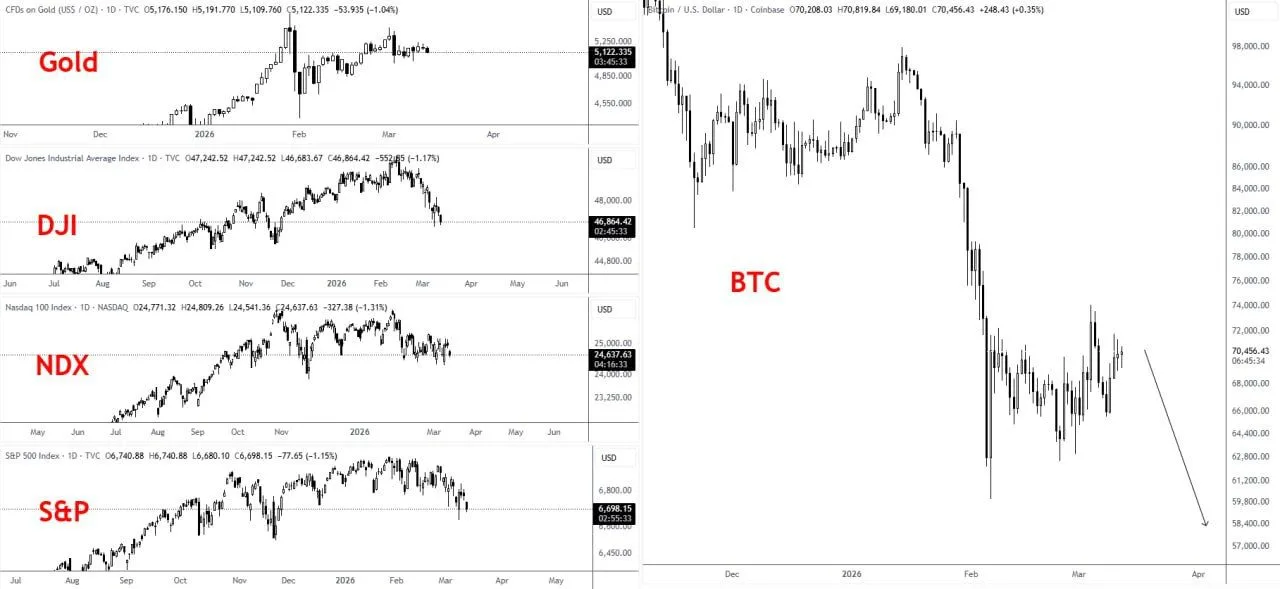
sauce: ClayTrading via TG
Even gold, considered a safe-haven asset by many, has entered a period of consolidation after hitting new highs. The metal is currently trading at around $5,095 Movement over the past week has been minimal.
This combination of falling stocks and flat commodity prices has some analysts questioning whether the crypto market has fully absorbed the broader change in sentiment.
In other words, if traditional markets continue to decline, will Bitcoin eventually follow suit?
The 2022 bear market fractal appears again.
Chart watchers often study past market cycles to identify repeating structures. One of the patterns that is gaining attention today reflects the formation of a bear flag that emerged during the 2022 recession.
At that time, Bitcoin formed a series of gains but failed to break through key resistance levels. Each rally gave investors hope before the market returned to a downward trend.
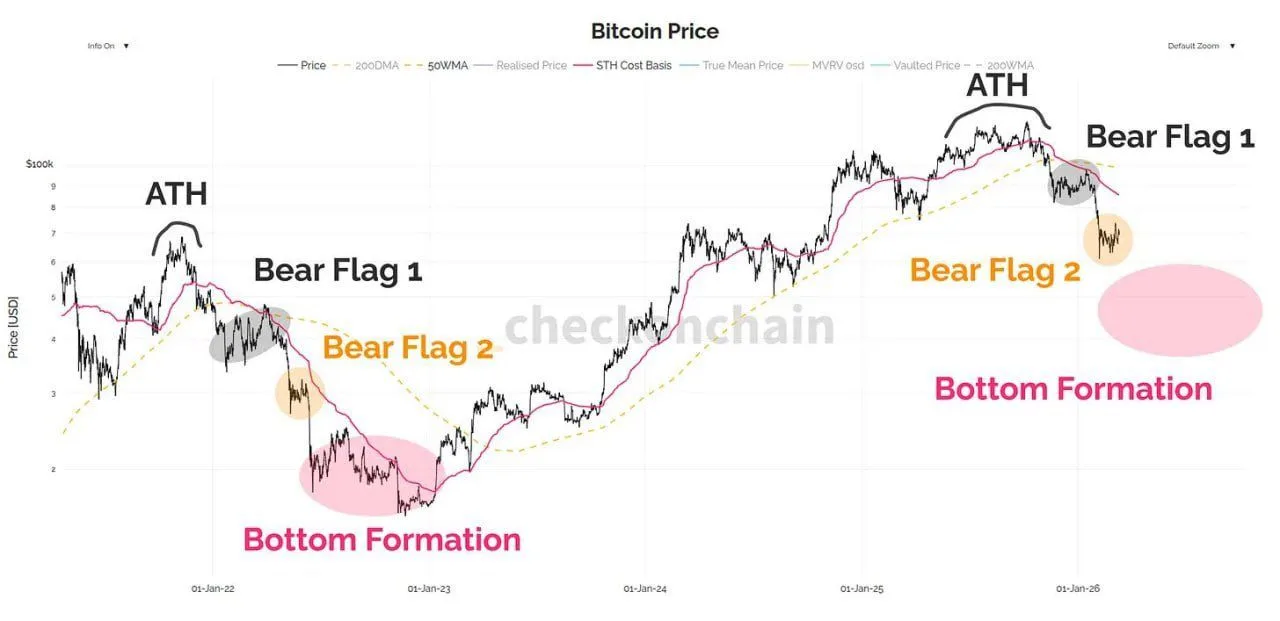
sauce: Alex via X
The current structure is strikingly similar. Price movements suggest a gradual wear pattern rather than a sharp reversal. Analysts who watch fractals believe there may still be more declines needed before the market forms a true bottom.
However, the situation remains complex. The supply dynamics and mean reversion patterns in today’s market are different than they were four years ago. This difference raises an interesting idea. Will history only partially repeat itself?
The $74,000 level is key
Short-term price trends currently revolve around key levels. Traders continue to keep a close eye on the $74,000 resistance zone.
Some analysts believe that a significant breakout above this level could invalidate the bearish theory. If buyers push through $74,000 with strong trading volume, that momentum could push Bitcoin closer to the $80,000 to $85,000 range.
So far, no such breakout has occurred. The market has approached that level but has not been able to reverse it into support. Until that happens, uncertainty remains. Meanwhile, the long-term situation remains important. Bitcoin is currently trading around 43% below its all-time high of $126,025, set in October 2025. This difference highlights the scale of the previous decline.
So the next move could shape the story for months ahead. Bitcoin could break resistance and begin a sustained recovery, or the bearish fractal could continue to develop.