
Mantle’s price hit a new all-time high on Tuesday, driven by partnerships that bootstrap liquidity and trading volumes on the network, while the project also expands its focus into the RWA sector.
summary
- Mantle prices hit a new high of $2.47 on Tuesday.
- Recent partnerships and the project’s expansion of focus into the RWA tokenization space are supporting MNT’s gains.
- MNT has disabled the rising wedge pattern on the daily chart.
Mantle (MNT) soared to a new high of $2.47 on the morning of October 7, Asian time, before stabilizing at $2.26 at the time of writing, according to data from crypto.news. It’s up 125% from last month’s low and 340% from this year’s low.
The token’s daily trading volume has also seen a notable increase, increasing from $125 million in early September to more than $612 million, with its market capitalization nearly doubling to $7.34 billion over the same period, making it the 32nd largest crypto asset at the time of writing.
Reflecting the surge in spot trading volume, open interest in the Mantle futures market has increased 26% over the past week to $4.85 billion, while the weighted funding rate has remained positive for nearly two weeks, a sign that long position holders are paying short position holders to maintain their positions, reflecting strong bullish sentiment in the market.
Why are mantle prices soaring?
There are three main factors behind the surge in mantle prices in recent weeks.
First, during Token2049, Mantle announced a new compliance-oriented RWA service. This move positions the project as one of the few L2 ecosystems actively being built in the real-world asset space, and the story has only gotten hotter this year.
Second, there was an important announcement at Mantle Mixer last week, where Trump family-backed World Liberty Financial revealed that it would launch its flagship stablecoin, USD1, on the Mantle Network. Considering that USD1 is currently the 6th largest stablecoin with a market capitalization of over $2.6 billion, this partnership is seen as a major boost to the credibility of Mantle’s DeFi and stablecoin ecosystem.
Finally, the bullish momentum for the token was also amplified by the growing synergy between Mantle and centralized cryptocurrency exchange Bybit. Late last month, Bybit announced the “Mantle x Bybit Roadmap” outlining deeper integration between the two platforms. Considering that Bybit processes over $30 billion in daily trading volume, MNT’s exposure and network effects have increased significantly in a very short period of time.
You may also like: Here’s why ChainOpera AI (COAI) price has skyrocketed over 600%.
But Mantle’s bull market could run into some trouble as smart money investors appear to be exiting their positions. According to Nansen data, the total amount of MNT held by smart money has declined by nearly 49% in the past 30 days, to just 18.07 million tokens at the time of writing.
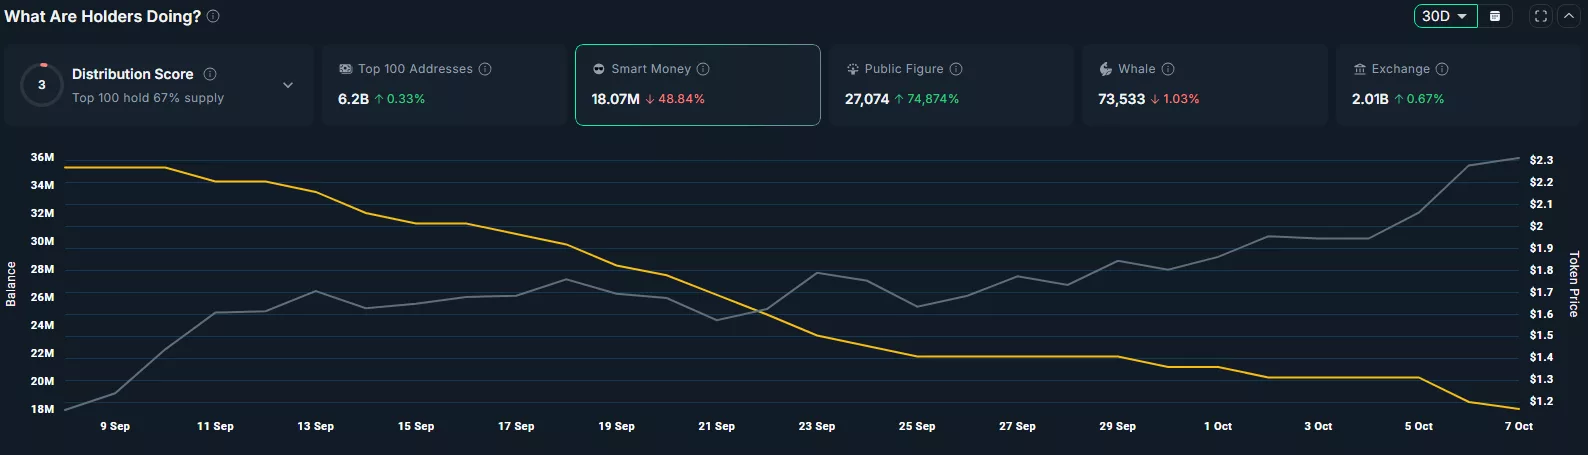
This kind of steady selling by experienced investors may raise some eyebrows. For some traders, this may be a red flag and a signal that those with deeper insight or early allocations are quietly taking profits. Although retail sentiment remains strong, the shift in smart money positioning may add some caution to what was previously a very bullish development.
On the daily chart, Mantle confirmed a bullish breakout from an ascending wedge pattern. A rising wedge is usually followed by a bearish reversal. However, in the case of MNT, the price broke out of the upper trend line, negating the typical bearish outlook that a rising wedge tends to imply.
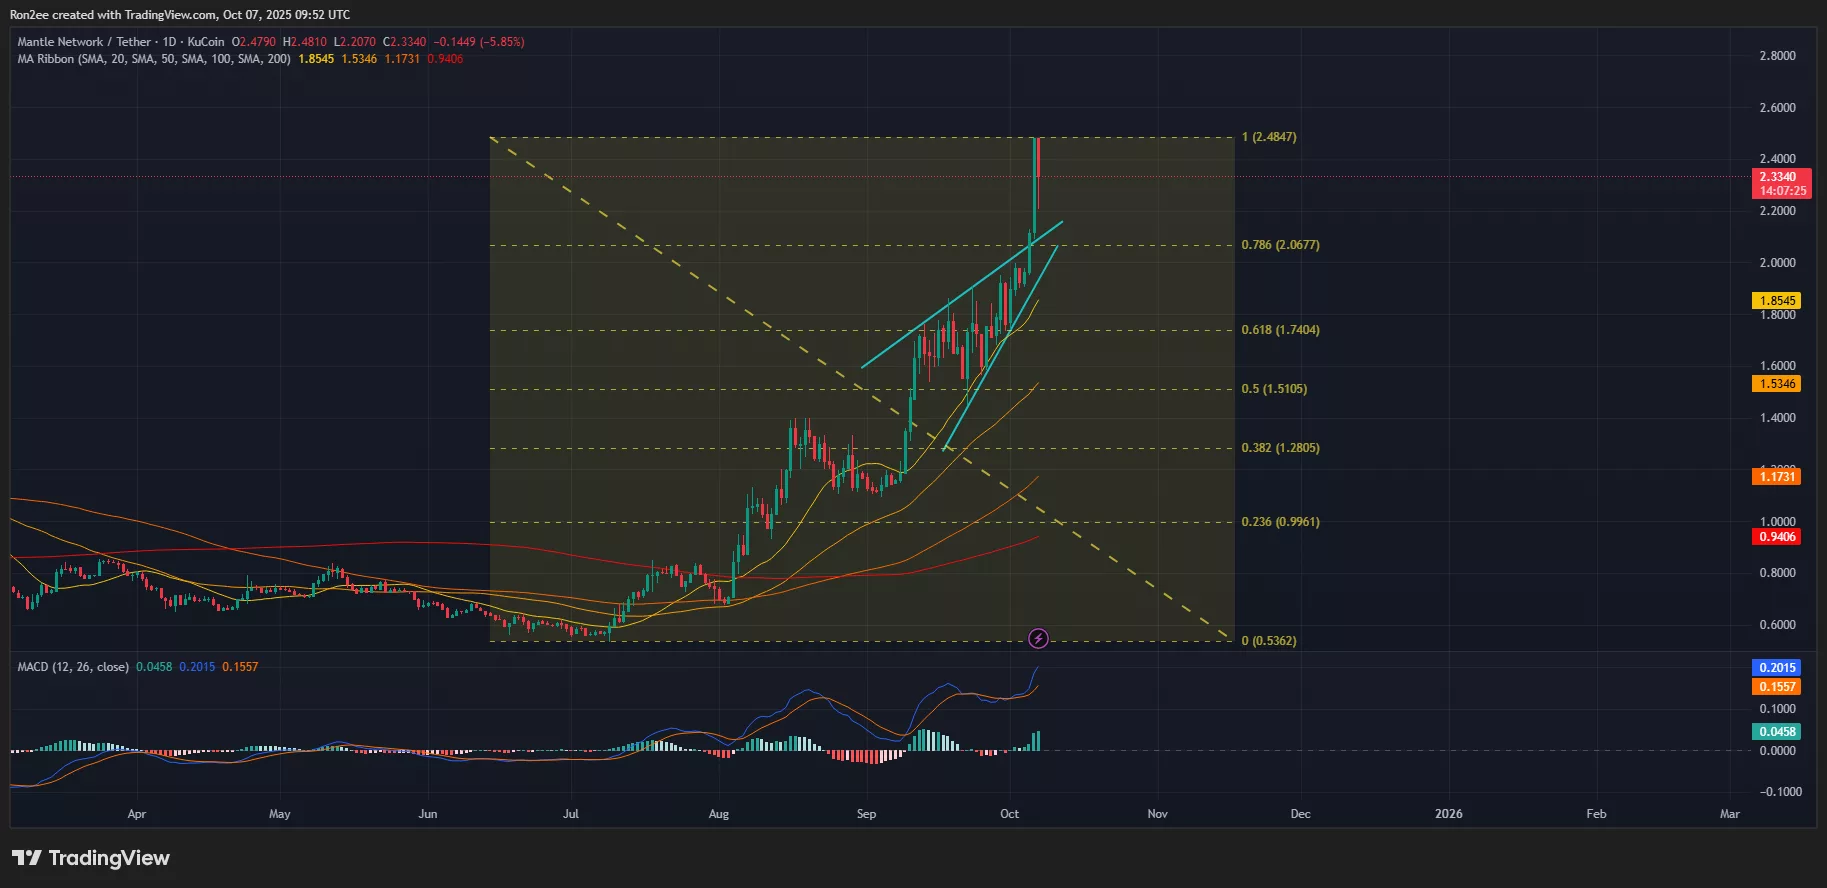
Mantle Price Overrides Bearish Pattern on Daily Chart — October 7 | Source: crypto.news
Such breakouts are not uncommon during strong uptrends, especially when the underlying fundamentals continue to support the bullish trend.
Adding to the bullish case, MNT is currently trading above all major moving averages, with the short-term average stacking on top of the long-term average, which is a classic signal of trend strength. Notably, the 50-day moving average has formed a golden cross over 200 days, which often precedes a sustained rally.
Momentum indicators support this bullish backdrop. The MACD is showing a positive crossover and the growth of the green histogram bar on the chart reflects buyer strength, all signs that the market is leaning heavily in the bullish direction.
Looking ahead, the next major resistance level lies at $2.60, which also acts as a psychological barrier for traders. A clean breakout of it could open the door for a rally towards the $3 mark, especially if volume confirms strongly.
Conversely, $2.00 serves as immediate support and is a level that the bulls would like to hold to maintain momentum.
read more: India focuses on RBI-backed digital currency with non-cryptocurrency push
Disclosure: This article does not represent investment advice. The content and materials published on this page are for educational purposes only.