On-chain indicators indicate that most Bitcoin $BTC$87,809.24 Investors are currently under pressure, with 63% of all assets invested in the largest cryptocurrencies having a cost basis of more than $88,000, according to Checkonchain data.
This means that most of the capital has entered the market at higher prices. $BTC Today’s deal. Invested wealth refers to the total value of capital deployed in Bitcoin the last time it moved on the chain. This is different from the cost basis, which is the average price at which Bitcoin was acquired.
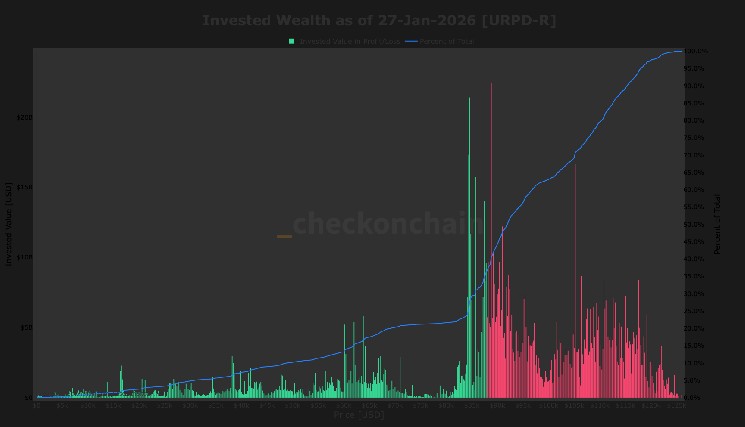
This insight comes from a measure called UTXO Realized Price Distribution (URPD). URPD indicates the price level at which the existing supply of Bitcoin last moved on-chain. Each bar represents the amount of Bitcoin in which the most recent trade occurred within a certain price range.
Bitcoin prices have been suppressed between $80,000 and $90,000 since November. URPD highlights how much capital is currently under the surface. Tens of billions of dollars are between $85,000 and $90,000. Selling pressure could increase if the price falls below $85,000 as investors look to limit losses. Long-term holders are already selling at the fastest pace in six months.
Adding to the risk, supply is relatively low between $70,000 and $80,000. If the $80,000 level, last tested in November, fails, a quick move towards $70,000 is likely.
Heading into February, Bitcoin is on track to end January largely unchanged, without the typical rescue rally after experiencing three straight months of declines. Historically, February has been a strong month, with average gains of around 13%, according to data from Coinglass. Whether history repeats itself may depend on how the market absorbs the current underwater supply overhang.