
While the crypto market remains on the defensive, Ethereum price is attempting a short-term rebound amid a broader downtrend that still dominates the picture.
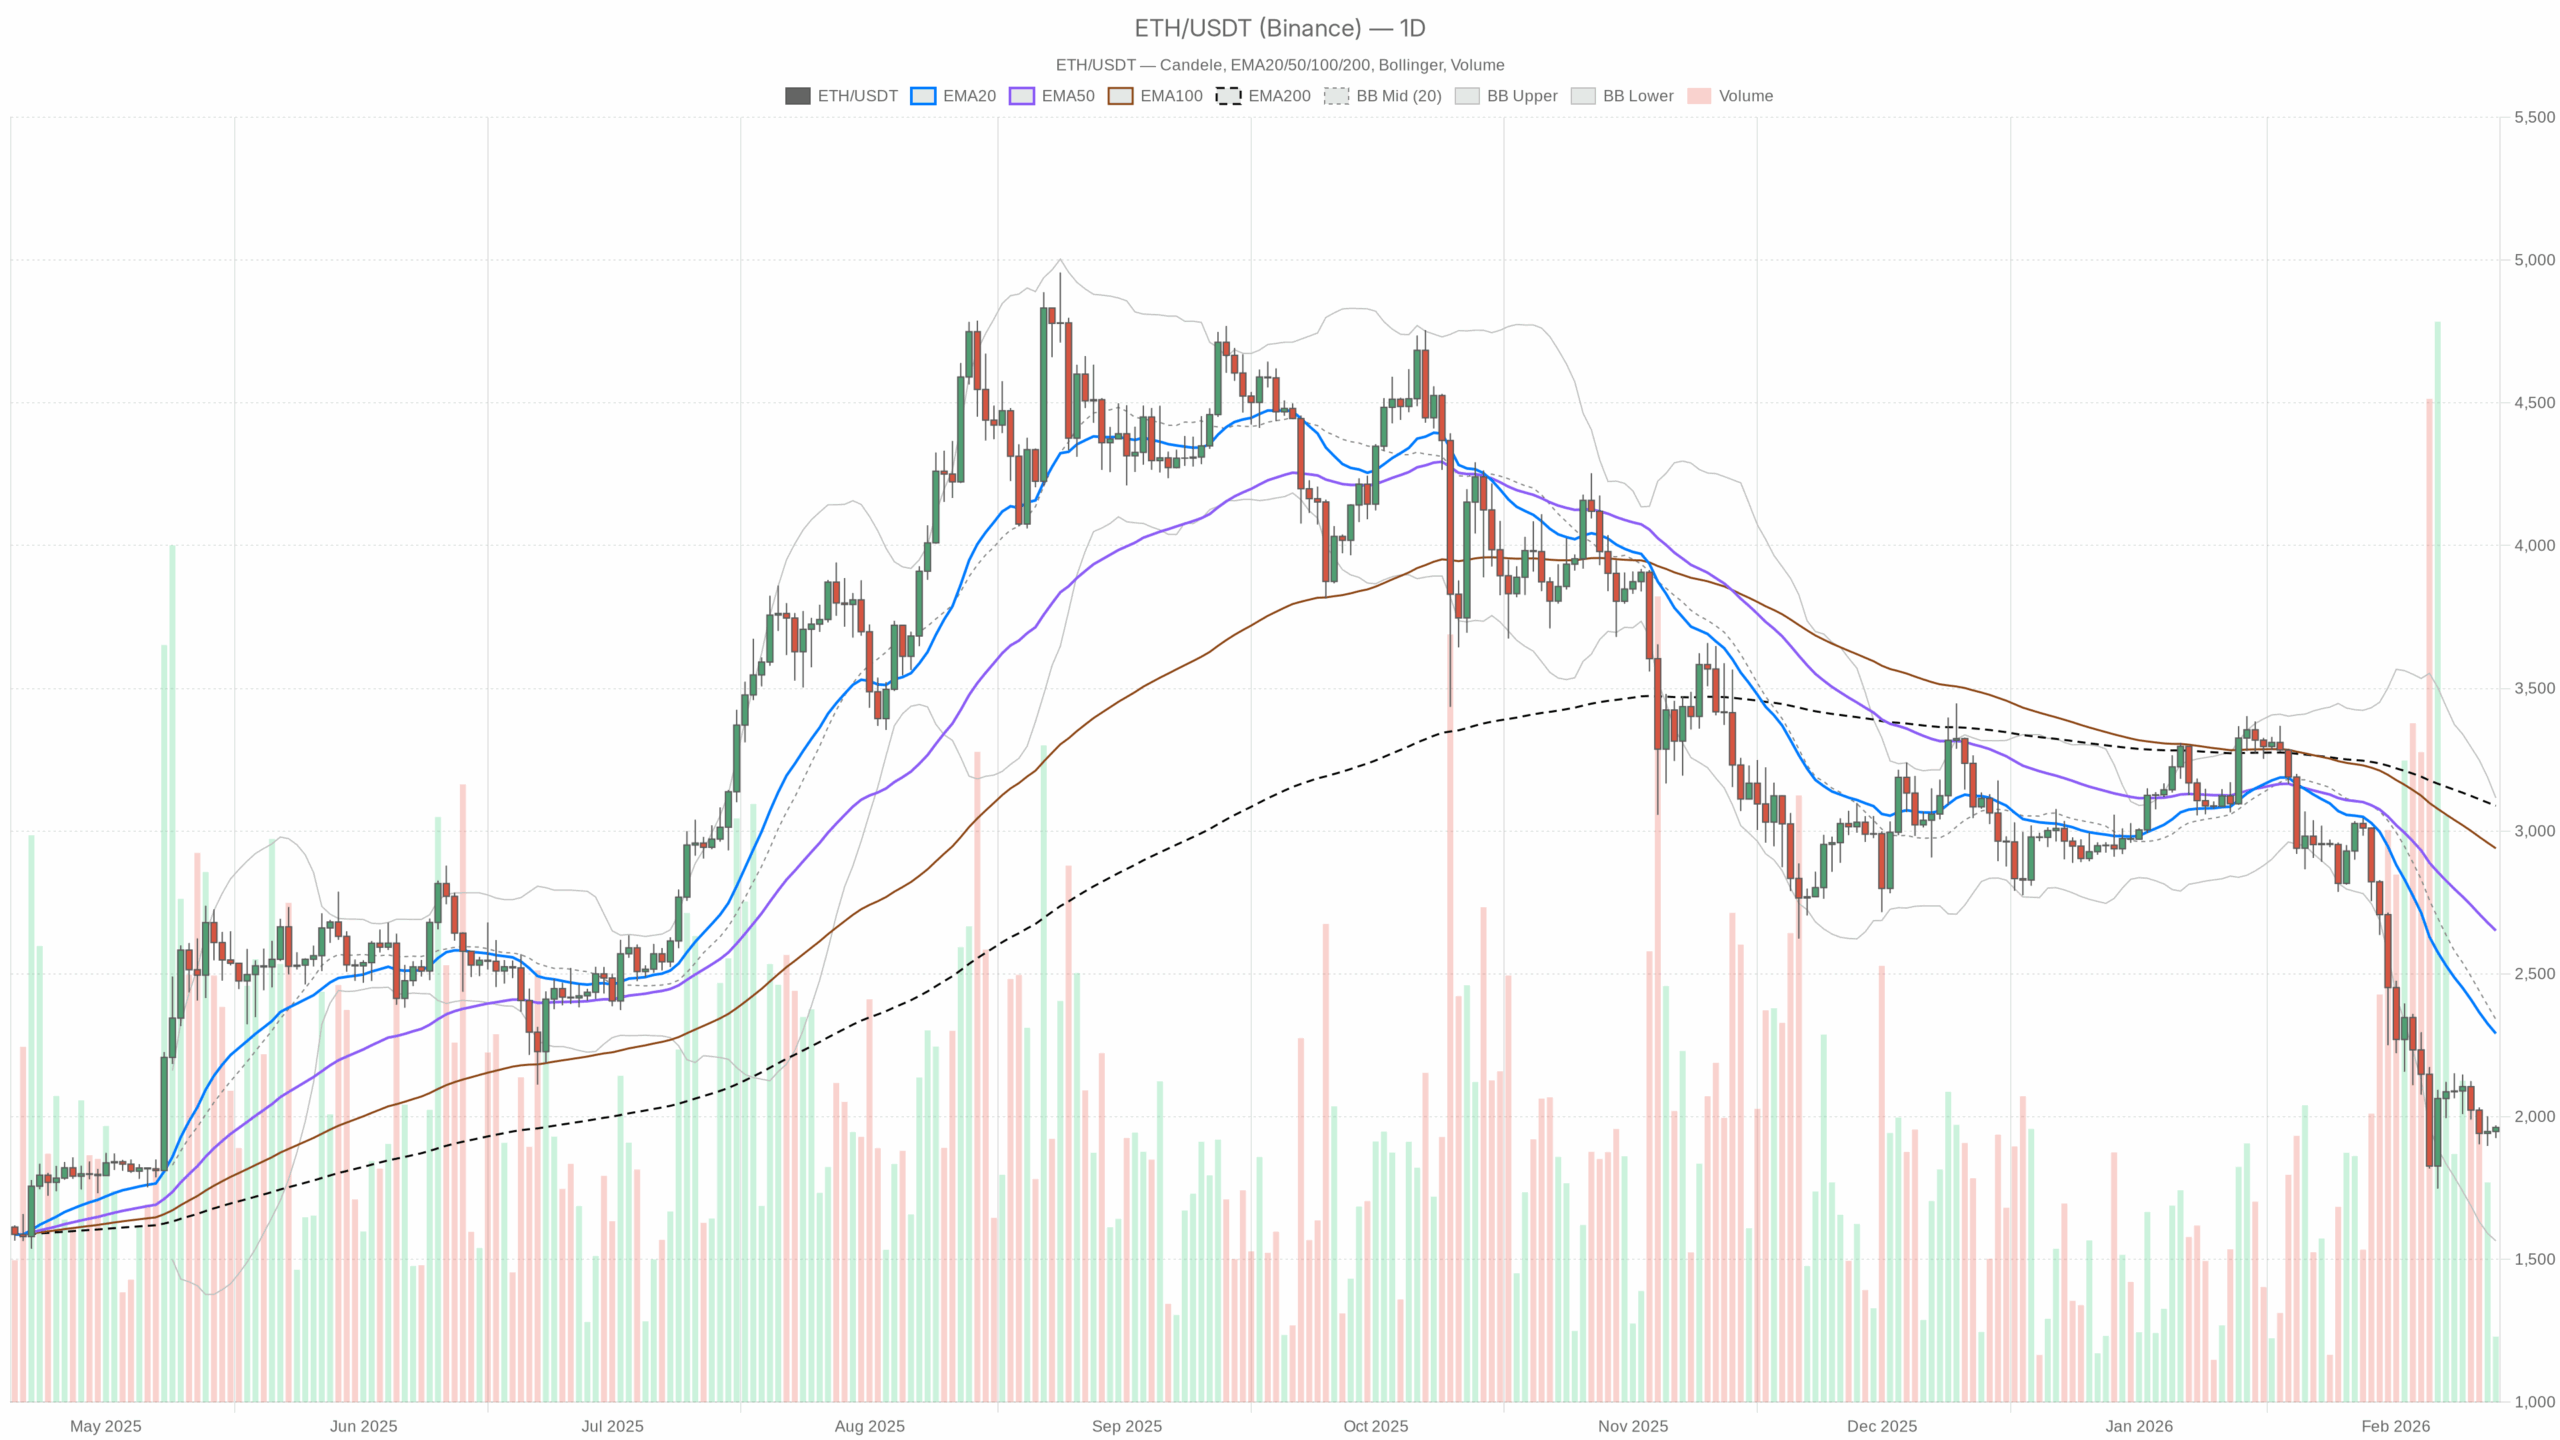 $ETH/$USDT Daily chart including EMA20, EMA50, and volume
Loading=”lazy” />
$ETH/$USDT — Daily chart including candlesticks, EMA20/EMA50, and volume.
Market Theory: Severe Daily Downtrend vs. Intraday Easing
Ethereum price vs. $USDT trading $1,960deep in a mature downtrend. The key takeaway at this point is that while the daily structure is clearly bearish, the short-term time frame is about to show a rebound. This is a classic bear market move. A violent countertrend bounces around in a broader downside.
The daily chart is now, so this moment is important. oversold Macro crypto sentiment extreme fear (9) and $BTC Dominance is high at about 56.6%. In other words, the market is defensive and capital is Bitcoin And stablecoins, and Ethereum, are less risky. The big question is whether this oversold background will cause a tradeable mean reversal up or just a pause until another leg lower.
Daily timeframe (D1): The dominant bias is bearish
On daily charts, the bias is clearly there. bearish. Trend, momentum, and volatility all indicate that the market is under steady selling pressure and is currently nearing depletion, but has not yet shown a proper trend reversal.
EMA (trend structure)
The price per day is $1,962well below all major moving averages.
- EMA 20: $2,291.05
- EMA 50: $2,651.67
- EMA200: $3,088.74
All three EMAs are above the price and at bearish levels, with a large difference from the 200-day. This is a mature downtrend and there is plenty of overhead resistance for the rally. This indicates that the path of least resistance is still down, and a pullback to the 20-day EMA will be a test of sellers’ resolve rather than evidence of new bullish legs.
RSI (Momentum)
RSI 14 (daily): 29.62
The daily RSI is below 30, meaning this move is technically oversold. This is consistent with how faded the chart is. In reality, it often occurs before a rebound or consolidation. However, in a strong downtrend, oversold conditions can last longer than people expect. In other words, the bears are in control, but their power is growing.
MACD (trend momentum)
MACD line: -269.62 | signal: -254.44 | histogram: -15.18
The MACD line is below the signal and deep in negative territory, with a small negative histogram. Downward momentum in the trend is still present, but the relatively modest histogram suggests that the selling impulse may be slowing rather than accelerating. This is consistent with the idea of a tired downtrend rather than a new breakdown.
Bollinger bands (volatility and positioning)
Middle band (20 SMA proxies): $2,340.59 | upper: $3,116.33 | Lower: $1,564.84
Price is trading below the intermediate band, relatively close to the lower band, and well below the midline. $2,340. The bands themselves are wide and reflect increased volatility. Being in the lower half of the band confirms a pressure zone dominated by sellers. However, the distance to the lower band also means that the risk of an immediate crash is slightly less severe than if the price were fixed in the band.
ATR (volatility)
ATR 14 (daily): $206.86
Daily ATR or higher 200 dollars Approximately $2,000 Has large assets. A variation of about 10% in either direction is readily apparent. This is not a quiet struggle. This is a volatile downtrend where both squeezes and flushes can be intense. Position sizing becomes even more important here than usual.
Daily pivot level (reference level)
The daily pivot levels are:
- Pivot point (PP): $1,952.04
- R1: $1,979.36
- S1: $1,934.82
Ethereum is hovering around an almost exact daily pivot $1,952–$1,962. Trading near a pivot after a decline often indicates a short-term pause or an area where intraday traders are fighting for control. A sustained push above R1 would indicate that intraday buyers have the upper hand. A decisive move below S1 would indicate a re-strengthening of the downtrend.
1-hour chart (H1): Short-term relief rebound in bearish conditions
After the dump, the 1 hour timeframe is about to stabilize. The system flags the regime as neutralThis is not surprising. We are seeing a short-term rebound, but it is not yet structurally bullish.
EMA (intraday trend)
About H1:
- price: $1,960.64
- EMA 20: $1,947.95 (price slightly above)
- EMA 50: $1,960.17 (price remains the same)
- EMA200: $2,046.70 (way above)
Price recovering and staying close to the 20-hour and 50-hour EMAs is a sign of short-term stabilization or relief upside. However, the 200 hour EMA is still far overhead. $2,047indicating the boundaries of a larger downtrend on this time frame. Intraday bulls have room to move higher without touching the higher time frame downtrend line in the sand.
RSI (intraday momentum)
RSI 14 (H1): 54.64
The hourly RSI is slightly above neutral, reflecting moderate bullish momentum after the previous decline. This looks more like a counter-trend rebound than an aggressive new buying cycle. The momentum is getting better, but the euphoria isn’t there.
MACD (intraday momentum shift)
MACD line: -0.90 | signal: -4.59 | histogram: 3.69
The MACD line is below zero but above the signal with a positive histogram. This is a typical short-term bullish cross within a broader bearish field. Sellers are pulling out and short-term traders are looking to pick up the lows. Nevertheless, as long as the MACD remains below zero, the pullback is still technically against the prevailing trend.
Bollinger bands (H1 positioning)
Middle band: $1,937.70 | upper: $1,969.48 | Lower: $1,905.92
The price is around the upper band $1,960–$1,969. This indicates that this rally has pushed Ethereum to the top of its recent intraday range. Often, if you grab the upper band of the hourly bar, it can either continue to rise or fade back to the average. In a bearish high timeframe regime, these upper band tags tend to be selling opportunities for swing traders.
ATR and Pivot (H1 Microrange)
ATR 14 (H1): $16.64
Intraday ATR is approx. $16 A typical hourly chart has a meaningful range, but a comparison with daily fluctuations suggests that it is manageable. That’s enough volatility for traders to take advantage of opportunities without being completely confused.
The hourly pivot levels are:
- PP: $1,962.20
- R1: $1,967.70
- S1: $1,955.14
The price is basically on the hourly pivot, just below R1. hold on top $1,955 and breaks cleanly on top $1,968 The rebound during the day is likely to intensify. Lose $1,955 after that $1,945–$1,935 The door opens for further downward rotation.
15-minute chart (M15): Execution context
The 15 minute chart is for timing, not macro bias. It is now rising more vigorously, coinciding with the H1 rebound.
EMA (microstructure)
About M15:
- price: $1,960.65
- EMA 20: $1,951.29
- EMA 50: $1,946.58
- EMA200: $1,956.66
Price is above all three EMAs, and the short EMA is slanted to the upside. This is a short-term uptrend within a broader intraday and daily downtrend. For scalpers and day traders, the drop towards the 15-minute 20 EMA is now defensible. However, this could quickly reverse if selling resumes on higher time frames.
RSI and MACD (short term momentum)
RSI 14 (M15): 61.27
The 15-minute RSI is above 60, reflecting healthy short-term buying pressure. It’s not at a blowout level yet, but it’s definitely in bounce mode rather than bottom fishing.
MACD line: 5.20 | signal: 3.59 | histogram: 1.61
The MACD of M15 is positive and above the signal in the green histogram. Momentum is clearly increasing in the very short term. This is the time frame where the rebound looks the strongest. That’s why it’s dangerous to ignore the daily downward trend and make extrapolations.
Bollinger Bands and Pivot (M15)
Middle band: $1,946.82 | upper: $1,969.61 | Lower: $1,924.03
The price is again near the upper band, reflecting the H1 situation. Pushed by short-term buyers $ETH To the top of the microwave. That’s often where late longs chase and patient players start trimming and fading.
15 minute pivot level:
- PP: $1,960.17
- R1: $1,963.64
- S1: $1,957.18
Since the price is located at the 15-minute pivot, the microstructure is exquisitely balanced. pop through $1,964 It may extend towards Bollinger’s upper band zone. Take a break below $1,957 This suggests that microbounces are losing momentum.
Broader market and sentiment context
The broader background of cryptocurrencies is Ethereum Now:
- $BTC Advantage: ~56.6% — Capital is flooding into Bitcoin, but not $ETH.
- 24-hour change in market capitalization: -1.31% — Broad risk-off tone.
- Fear and Greed Index: 9 (Extreme Fear) — Very low risk appetite.
The latest news headlines are: Cryptocurrency depressionETF outflows from Bitcoin and Ether, risk-off behavior. This lines up nicely with what the chart shows. In other words, this is a defensive environment where bulls are sold rather than chased.
Ethereum price scenario
Main scenario (based on D1): Bearish with oversold risk of sharp rebound
The dominant scenario remains bearish As defined on the daily chart, price is well below all major EMAs, MACD is negative, and RSI is oversold. Important nuance: We are in the later stages of this down leg. A sharp countertrend rally The chances are high, but by default they are still selling bull markets rather than new uptrends.
bullish scenario
To be bullish, Ethereum needs to turn this oversold background into a sustained mean reversal move.
- Step 1: Hold above the daily pivot (around $1,952) and build a base above $1,930-$1,940. Losing that band leaves control completely in the hands of the bears.
- Step 2: Use the intraday strength (upward momentum in H1 and M15) to sustain above the short-term resistance cluster around $1,980-$2,000 (near intraday R1 and upper Bollinger area).
- Step 3: It extends towards the daily 20 EMA of approximately $2,290. This is the first real test to see if sellers are willing to reload. A strong push towards this level with the RSI rising towards 45-50 on a daily basis would indicate a true corrective rally.
What invalidates the bullish scenario?
if $ETH Failure to break above around $1,930 weakens the notion of a sustained rebound, especially if it closes the daily candle well below the daily pivot and S1. The new breakdown of the daily RSI remaining below 30 indicates that the market is not yet ready to revert to the mean.
bearish scenario
The bearish path assumes that this intraday rebound is a typical dead-end rally within a strong downtrend.
- Ethereum price is struggling to break above $1,960-1,980 and is unable to regain the $2,000 handle with any confidence.
- The intraday indicators (H1 and M15 RSI/MACD) roll over from the current slightly overbought levels, but the daily RSI remains oversold, indicating another bar down.
- Prices break below the $1,930-$1,940 support and head toward the lower end of the daily Bollinger region, leaving room for a downside towards the mid-$1,600s if selling accelerates again.
What would invalidate the bearish scenario?
A definitive reclamation of the $2,050-$2,100 region, where the H1 200 EMA currently resides, would be the first serious red flag for bears. If the price rises above that zone, the MACD’s downside momentum weakens further, and the daily RSI recovers above 40, the argument for a simple continuation of the decline becomes much weaker. A real structural victory for the bulls would be a sustained recovery of the daily 20 EMA near $2,290. Until that happens, the bearish thesis will structurally remain in place.
Positioning, risk and uncertainty
Across time frames, the message is clear. Everyday is bearish and oversoldmeanwhile Trying to rebound during the day. This tension is where traders usually get chopped. They could chase a short-term blue candle into a larger downtrend or sell short into a hole just before a squeeze.
Rising daily ATR, extreme fear sentiment, negative news flow; $ETH Position sizing and time frame discipline are more important than directional certainty as it is well below the key EMA. Short-term traders may take advantage of the uptrend in M15 and H1 to go tactically long, but they need to trade quickly because they are trading against the daily bias. Swing traders leaning into a daily bearish trend often consider weakening into a resistance zone rather than selling all the lows.
There is nothing on this chart that rules out the possibility of another brutal short squeeze higher or even more yielding legs lower. Both fit the current volatility regime. The only thing the market is clearly saying is that we are on the defensive with Ethereum and need to size our exposure with the understanding that Ethereum’s price can fluctuate by hundreds of dollars in a very short period of time.