
Bitcoin prices continued to fall as President Trump’s threat to import goods from China reignited concerns about a flare-up of the US-China trade war.
summary
- President Trump’s threat to ban cooking oil on October 14 deepened concerns about a trade war.
- Bitcoin fell below $112,000 amid volatility with trading volume of $90 billion.
- Increased liquidations and uncertainty about Fed rate cuts are exacerbating bearish sentiment in the market.
Bitcoin was trading around $111,925 at press time, down about 1.3% over the past day as headlines about deteriorating U.S.-China trade relations rattled risk appetite and traders reduced leverage.
Despite the pullback, trading activity recovered. Bitcoin (BTC) 24-hour spot trading volume increased by about 35% to $90 billion, and derivatives trading volume increased by about 40% to $144 billion, according to data from CoinGlass.
At the same time, open interest fell by about 2% to $72.5 billion, a sign that traders are closing out leveraged positions rather than opening new ones. While this tends to calm volatility in the short term, it can leave the market vulnerable to sudden movements.
Geopolitical tensions put pressure on Bitcoin price
On October 14, US President Donald Trump escalated tensions with China by threatening to ban imports of edible oil from China in response to China’s continued boycott of US soybeans. The statement came after weeks of tariff threats and countermeasures that deepened fears of a full-blown U.S.-China trade war.
You may also like: US seizes $15 billion in Bitcoin in forced labor cryptocurrency scam
Global markets were spooked by the move, with stocks, commodities and cryptocurrencies reacting sharply. The Nasdaq fell as much as 3.5% as investors turned to safer assets such as gold and U.S. Treasuries. Bitcoin, often considered a “risk-on” asset amid macro uncertainty, fell along with stocks.
Last week’s flash crash, in which more than $19 billion of long crypto positions were liquidated in 24 hours, the largest liquidation in history, was followed by new uncertainty. An additional $600 million in leveraged positions were liquidated in the past day as traders de-risked.
The market is currently focused on the next Federal Reserve meeting (October 29-30), with an 89% chance of a 25bps rate cut. However, hawkish overtones in recent Fed minutes highlighted the persistence of inflation and tempered optimism. A stronger U.S. dollar and rising U.S. Treasury yields are putting pressure on Bitcoin, which tends to underperform when liquidity conditions tighten.
Technical analysis of Bitcoin price
Bitcoin is showing short-term weakness after falling below a major moving average. The 10-day, 20-day, and 30-day EMAs are above the price, indicating short-term pressure, but the 200-day average of around $108,000 to $107,000 is acting as long-term support.
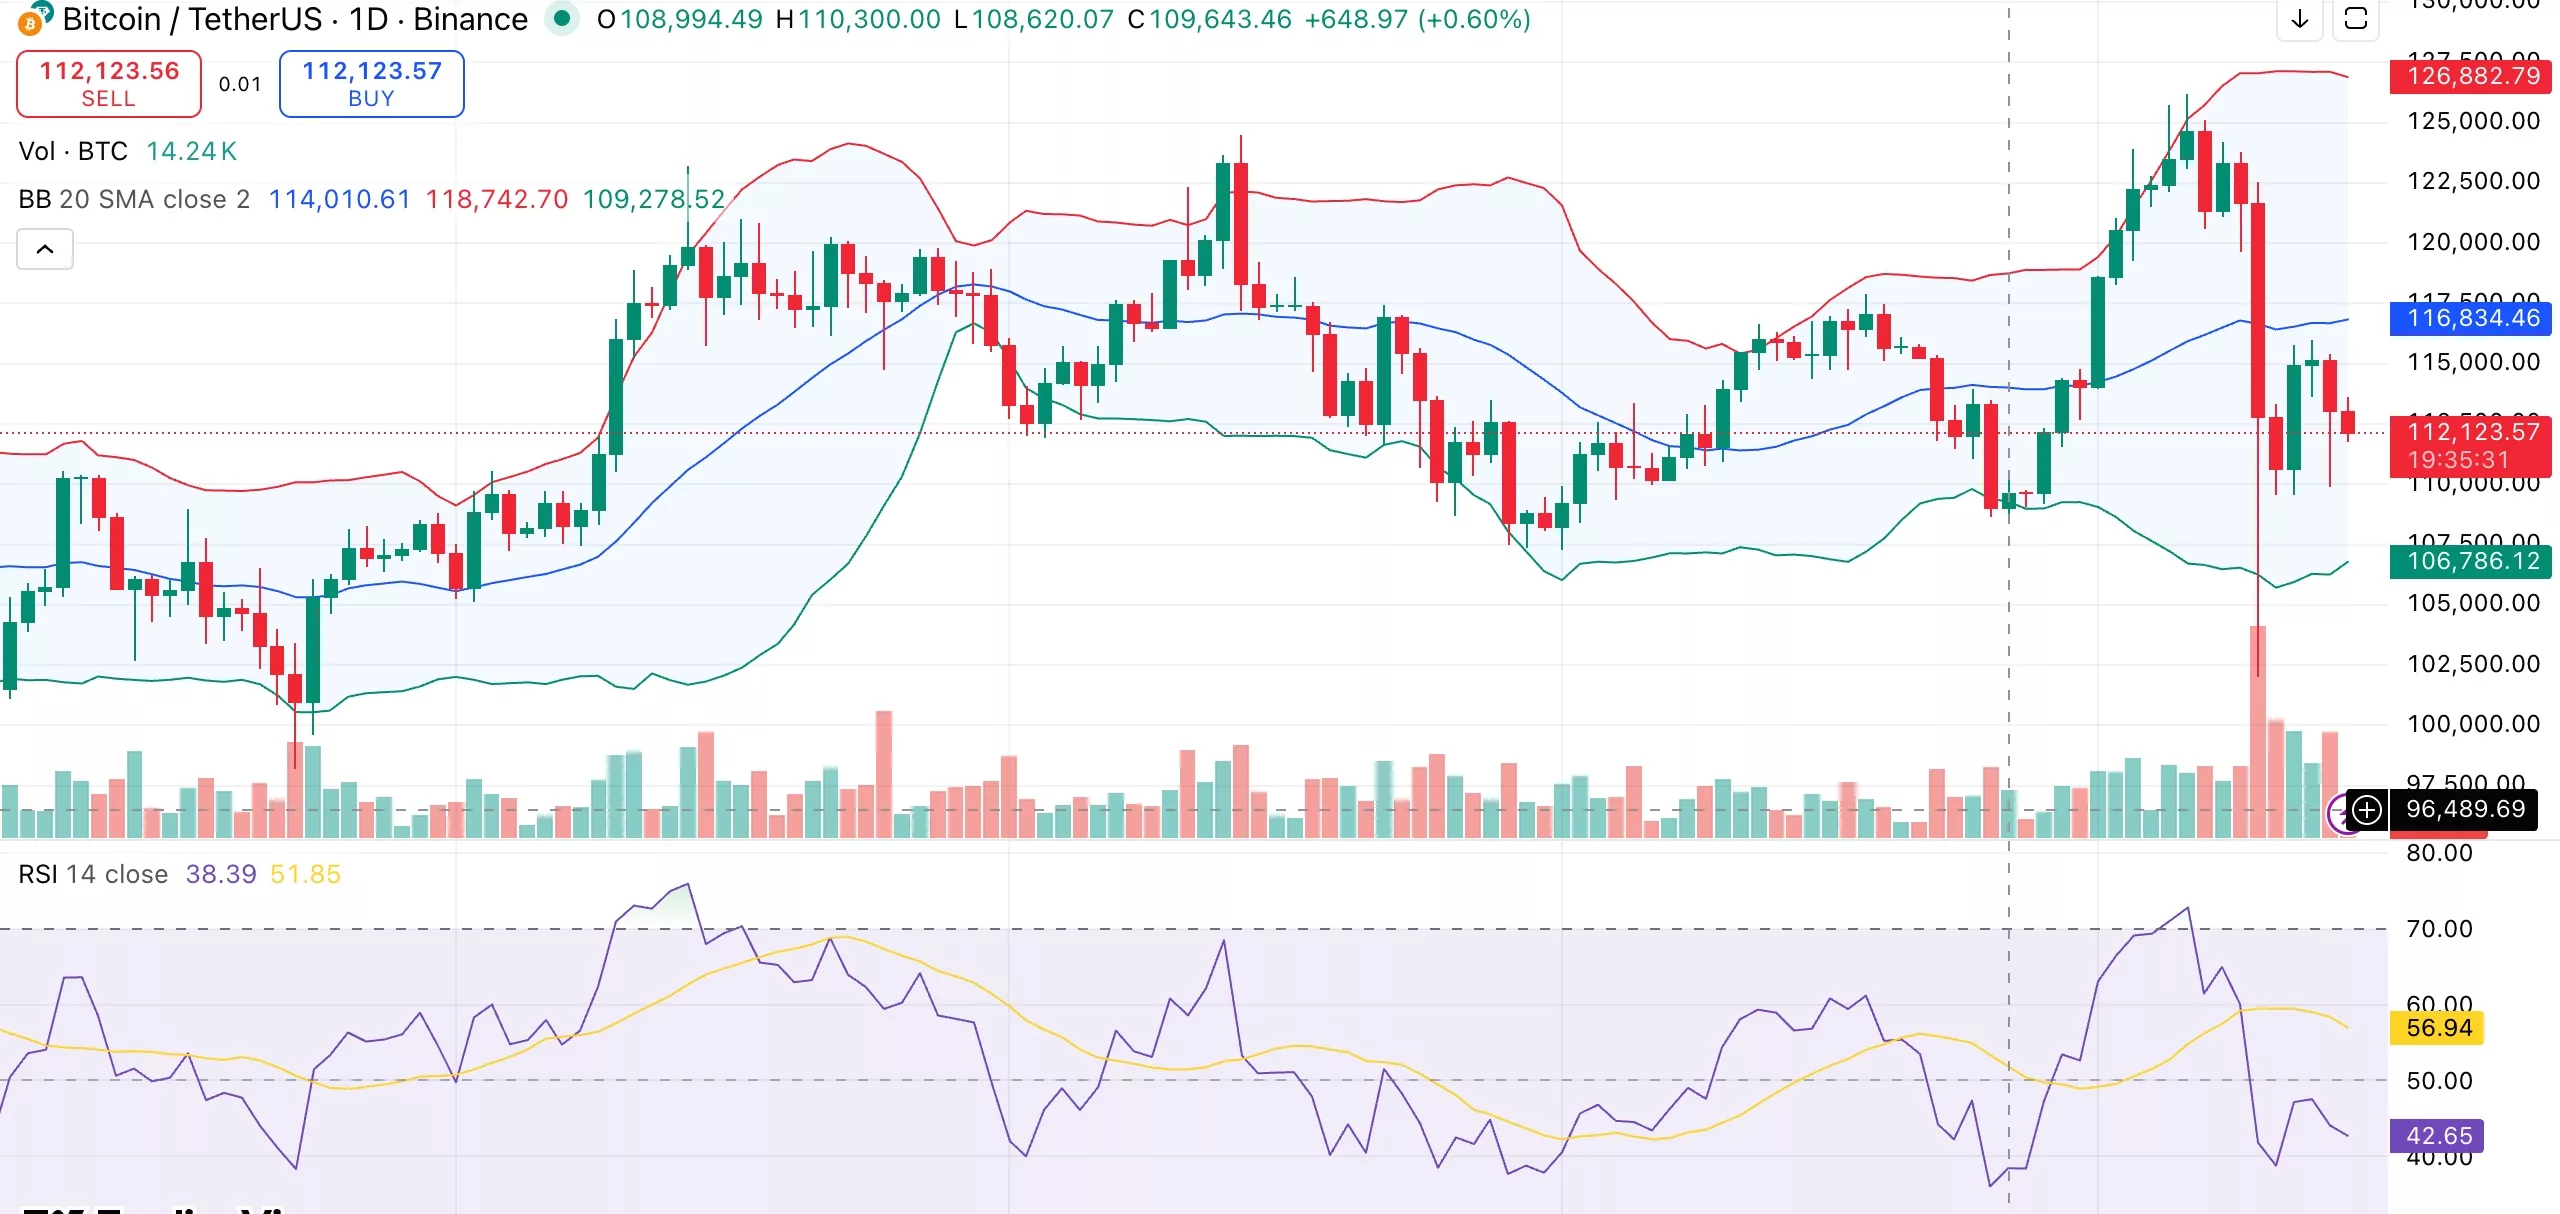
Bitcoin daily chart. Credit: crypto.news
Momentum indicators are bearish. A relative strength index of 43 indicates waning strength but not oversold, and MACD and momentum are both negative.
The trend signal is moderate, with an average directional index of 25, suggesting further deepening is possible. Prices are trading in the lower half of the range, with Bollinger Bands showing cooling but rising volatility.
A return to the $115,000-$116,000 resistance level could reopen the path to $123,000. Support amounts are approximately $108,000 to $107,000. If you lose it, you risk dropping to $104,000 or even $100,000. The bulls will need more volume on the rebound, while the bears will be looking for more flashes towards the 200-day band.
read more: Can Bitcoin regain $120,000? Analysts warn of macro pressures