
Bitcoin prices have entered a bear market after falling 20% from this year’s all-time high, and key technical indicators point to an even steeper decline in the short term.
summary
- Bitcoin prices fell into a domestic bear market this month.
- On the weekly chart, it is forming an ascending wedge.
- The coin has formed a bearish pennant pattern on the daily chart.
Bitcoin (BTC) was trading at $101,900 on Sunday, a significant drop from its year-to-date high of over $126,300. Its market capitalization has fallen to about $2 trillion.
BTC prices have plummeted as deleveraging continues among investors after last month’s massive liquidations. As a result, futures open interest has plummeted to $67 billion from a peak of $94 billion last month.
Coins have also fallen sharply amid a continued sell-off by whale investors who have dumped billions of dollars worth of coins over the past few months. Whale sales often cause significant selling pressure among other retail traders.
Meanwhile, investors have been dumping Bitcoin ETFs recently. Those ETFs shed more than $558 million in assets on Friday, according to data compiled by SoSoValue. The outflow brought the weekly total to $1.22 billion, up from $798 million the previous week.
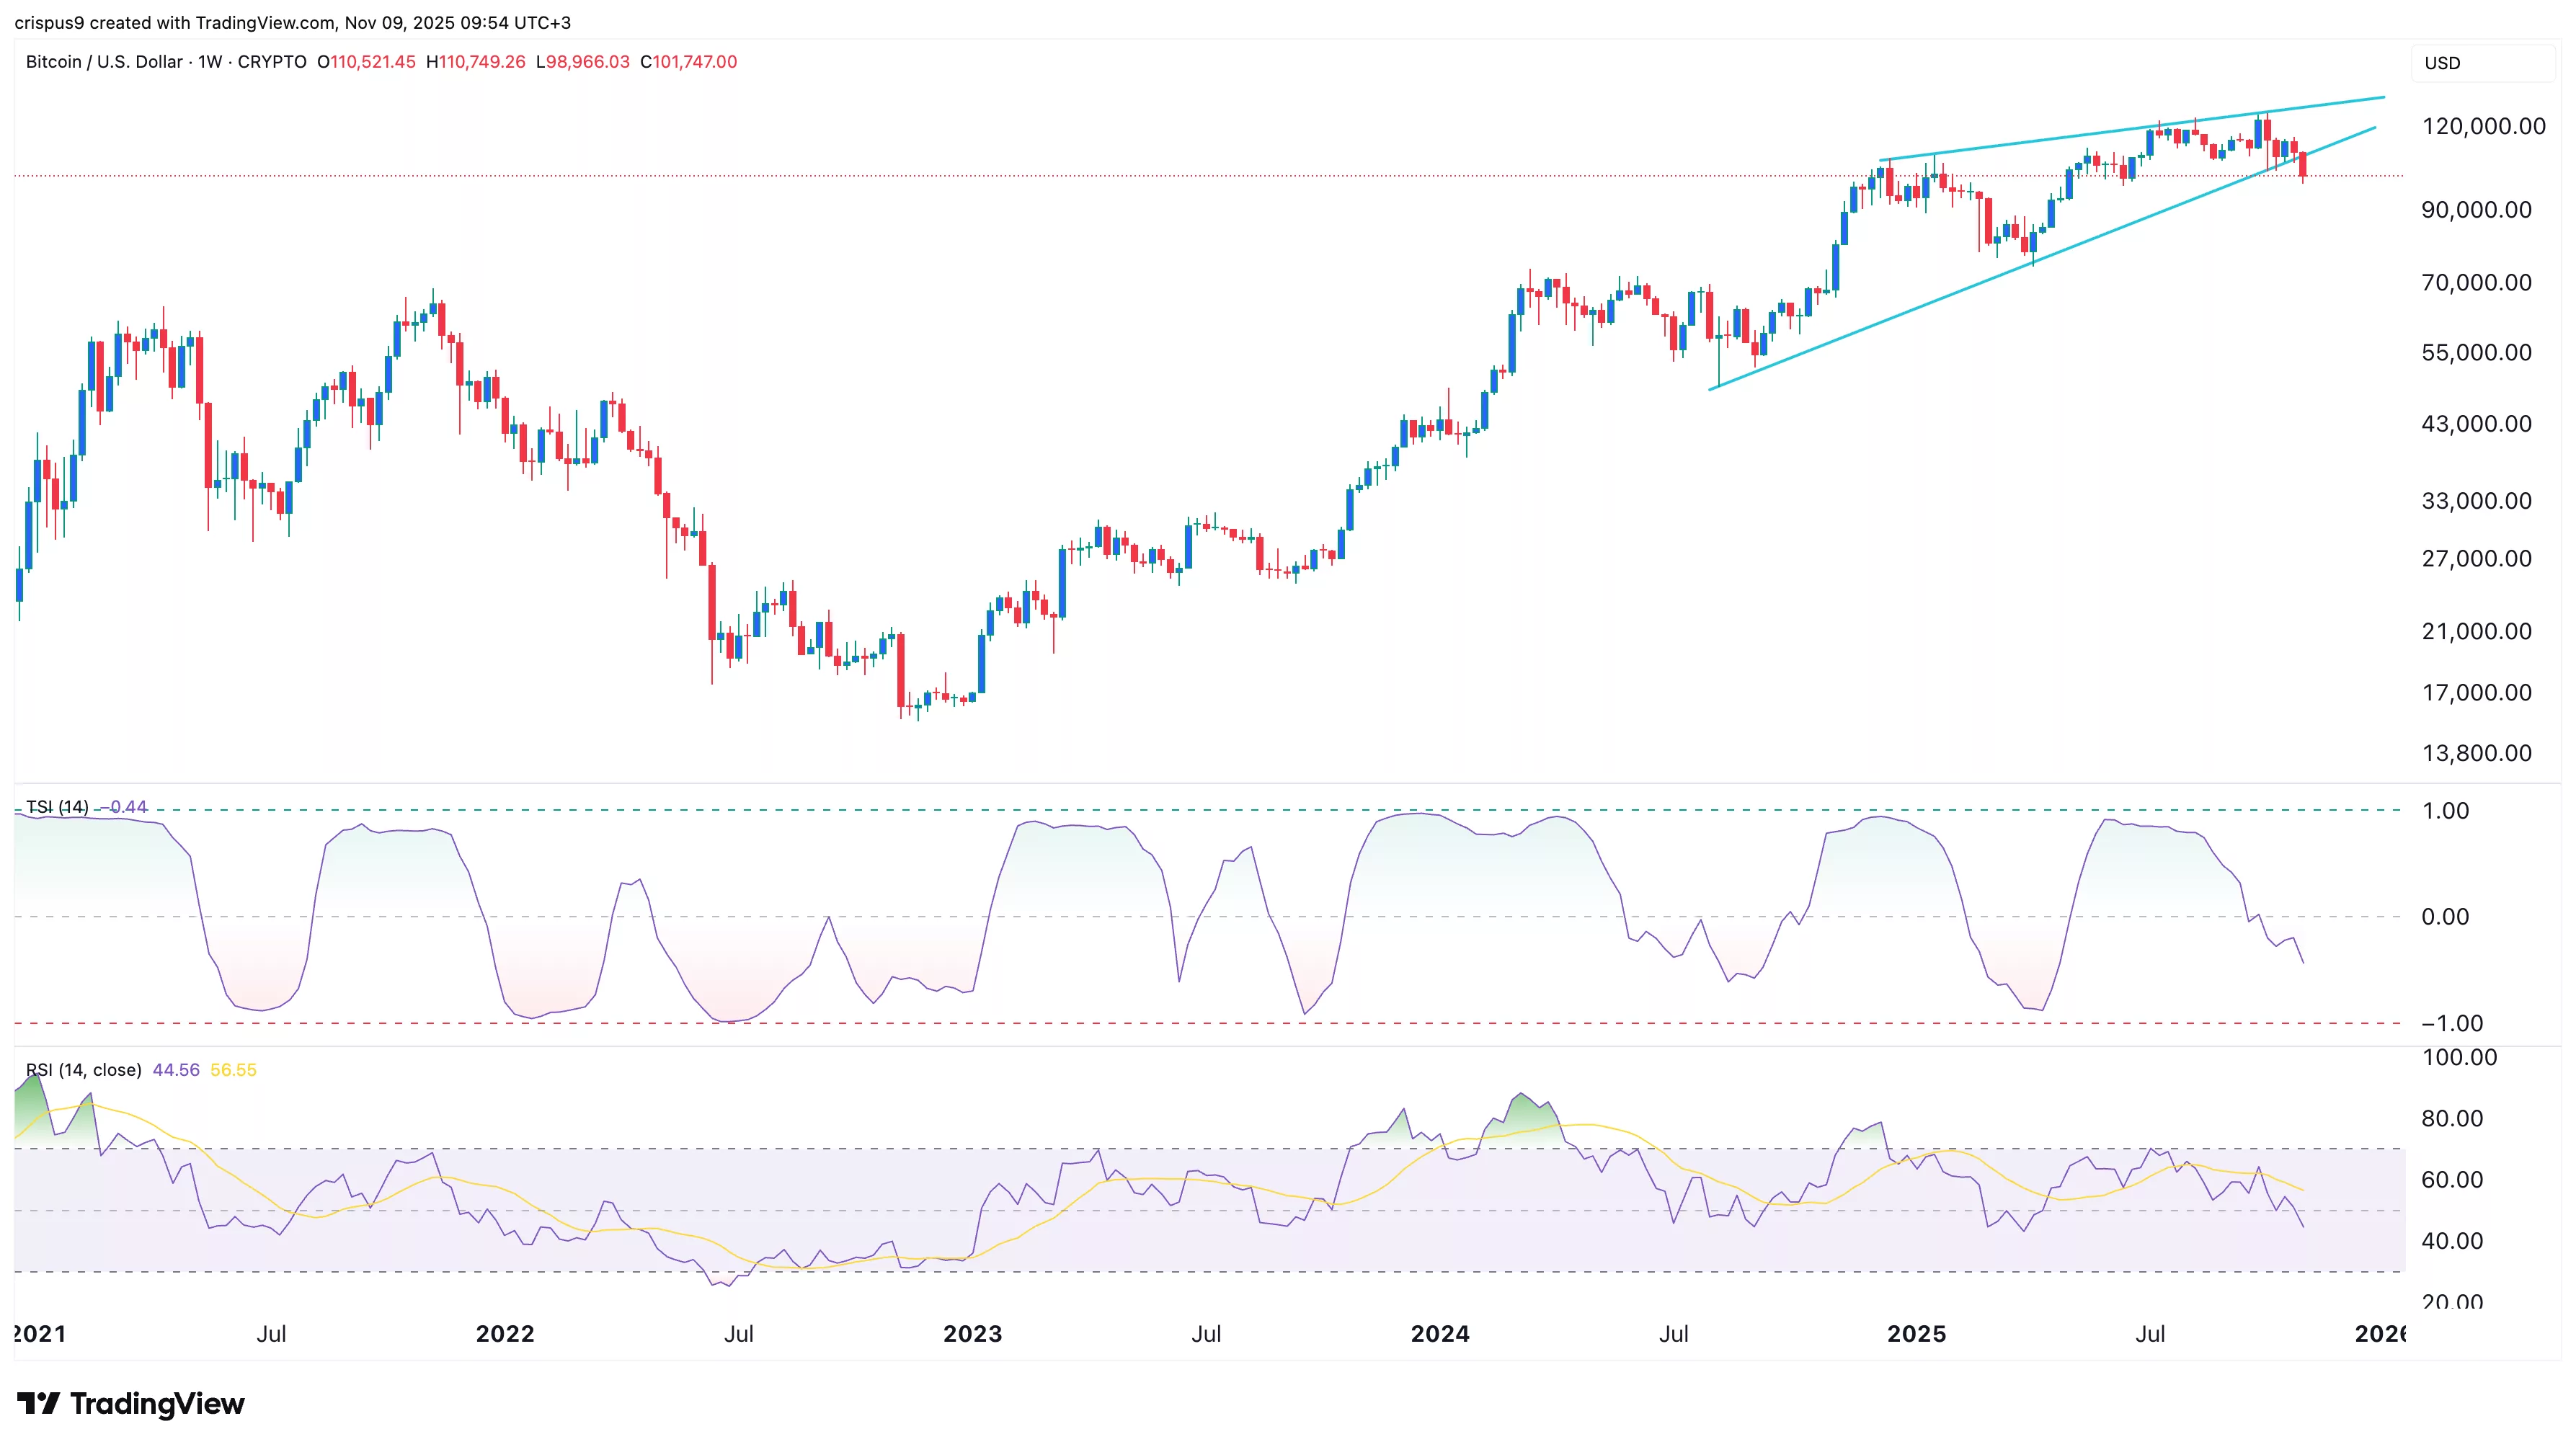
Bitcoin price forms a rising wedge on weekly chart

BTC price chart |Source: crypto.news
The weekly chart suggests that BTC price may be on the verge of another sharp decline this year. It is forming an ascending wedge pattern consisting of two rising and converging trend lines. The price has already broken below the bottom of this wedge, confirming the possibility of a crash.
Bitcoin is also forming a bearish divergence pattern. The relative strength index continues to form a series of lows and is currently below the neutral point of 50.
A similar thing happened with the trend strength index, which has fallen below the zero line and is trending downward.
BTC price is forming a dangerous pattern on the daily chart
Bitcoin price chart |Source: crypto.news
The daily chart also shows that the coin is forming some dangerous chart patterns. It is currently in the process of forming a bearish pennant consisting of vertical lines and a symmetrical triangle pattern. This pattern usually leads to further declines.
The coin also formed a double top pattern at $124,496 and a neckline at $107,390. Most importantly, on November 1st, the 50-day and 200-day moving averages crossed, forming a death-cross pattern.
Therefore, the coin is likely to continue declining as sellers target last June’s lowest level at $98,220 as the key support. A break below this level could lead to further downside and a drop to $95,000.
Disclosure: This article does not represent investment advice. The content and materials published on this page are for educational purposes only.