
Bitcoin is trading just below long-term resistance, which has been a key turning point in past market cycles. At the time of writing, the asset was around $112,100, down slightly over the past 24 hours and down 8% over the past week.
Despite the weak short-term performance, several technical and on-chain indicators point to potential strength building in the background.
Logarithmic curve and RSI are close to critical levels
Bitcoin price is nearing the top of its long-term logarithmic curve, a level that has served as a ceiling in previous cycles. According to EtherNasyonaL, BTC “has not yet exceeded the resistance of the logarithmic curve”, and once this resistance is overcome, the market tends to accelerate.
Bitcoin Top is not included. 🔃$BTC has not broken above the logarithmic resistance yet, so the parabolic rise is sure to continue.
As in previous cycles, the market quickly gained momentum once this curve broke.
Moreover, RSI is not included… pic.twitter.com/JjH99Fot2M
— EᴛʜᴇʀNᴀꜱʏᴏɴᴀL 💹🧲 (@EtherNasyonaL) October 14, 2025
Meanwhile, the monthly RSI is also around 72, but still below the long-term trend line. Back in 2017, the RSI broke through the same trend line just before the price spiked. The current setup shows that price and RSI are approaching similar conditions again, but no breakout has been confirmed so far.
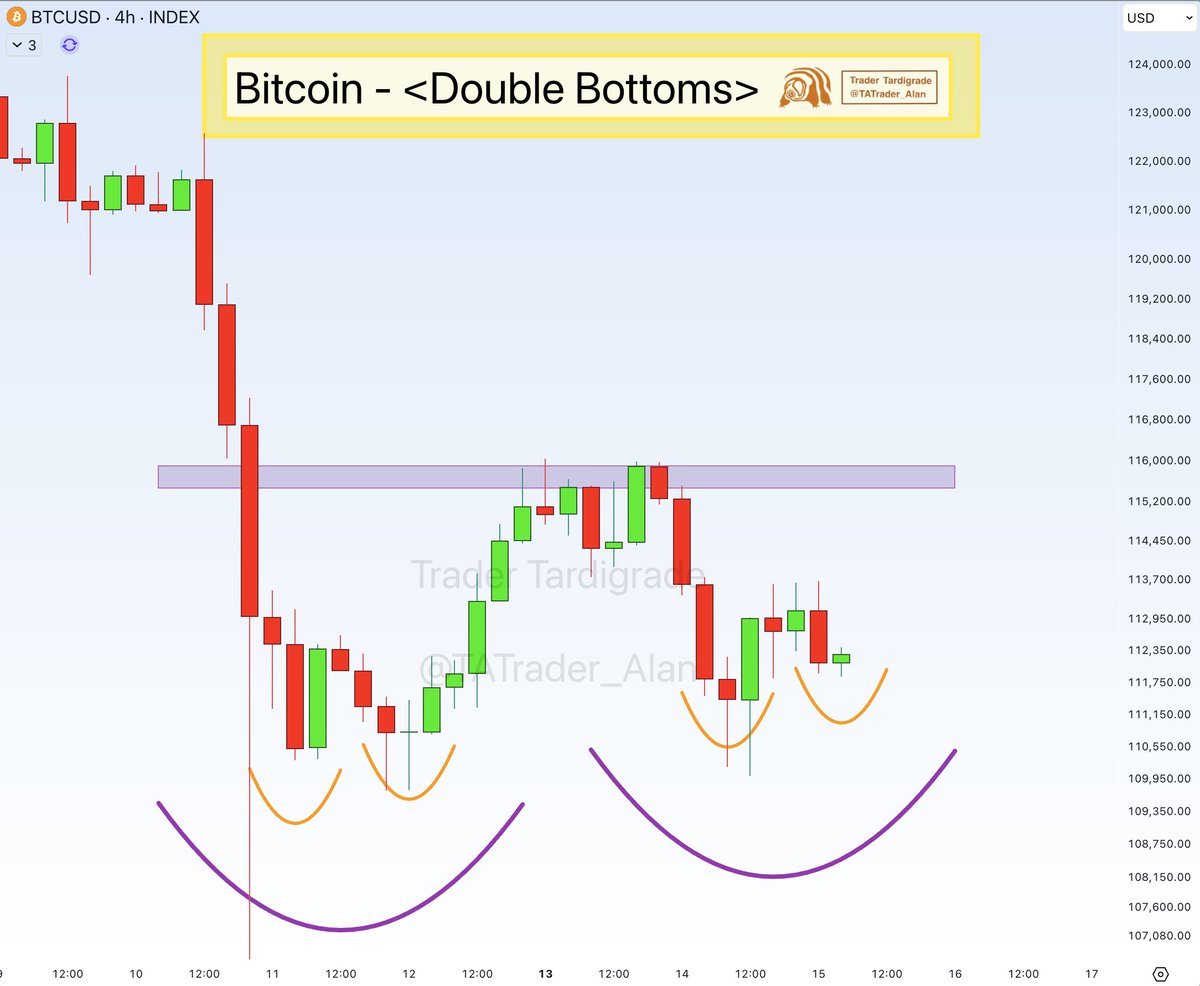
Additionally, Trader Kumamushi pointed out that Bitcoin is forming a double-dip pattern on the 4-hour chart. The second low is higher than the first, which often indicates that sellers are losing momentum and buyers may return.
The resistance line, or neckline, of this pattern is around $116,000. Once this level is exceeded, the setup is finalized. Until that happens, the pattern remains unidentified. This type of construction has previously caused upward movement, but only if the neckline is resolved with volume.
You may also like:
- Fed’s dovish stance could stimulate crypto markets in the fourth quarter
- Analysts say retail uncertainty after crypto crash suggests buying opportunity
- 90% of altcoins underperform the main trend: what this means for investors
Price range marks $119,000 as the main level
Glassnode’s MVRV pricing model places the current Bitcoin price at approximately $119,000, just below the +0.5 standard deviation band. Analyst Ali Martinez said:
To maintain bullish momentum, Bitcoin $BTC needs to regain $119,000. Otherwise, the price range suggests a correction towards $96,530. pic.twitter.com/I7IGhKcXjX
— Ali (@ali_charts) October 15, 2025
If not, it could fall toward the model’s average value of $96,526.
These price ranges are used to map historical highs and lows. Bitcoin is currently in an intermediate range, with no clear direction in sight until it moves above or below one of these thresholds.
On-chain data shows changes in market behavior
Data from XWIN Research Japan suggests that Bitcoin is currently in the late stages of its cycle. Net Unrealized Gain/Loss (NUPL) is +0.52. Over the past few years, this level has signaled a shift from increased optimism to more speculative behavior. Currently, about 97% of the supply is profitable.
Currently, short-term holders account for 44% of Bitcoin’s realized market capitalization. This is the highest level recorded. This indicates that many long-term holders are selling more while new buyers are entering the market. According to XWIN, “The structure seems to be different this time.”, pointing to ETF inflows and widespread liquidity as stabilizing factors.
As long as the price remains below the resistance, a breakout is not yet confirmed. A move above $119,000 with a break in the RSI could indicate a continuation of the trend.