Bitcoin is entering a more definitive part of its recovery. After spending weeks rebuilding from the February flash, the market is no longer just defending support. Now closing in on a major resistance cluster around $80,000, this is the kind of area where a simple relief rally will either mature into something bigger or be brought back into range.
Bitcoin Price Analysis: Daily Chart
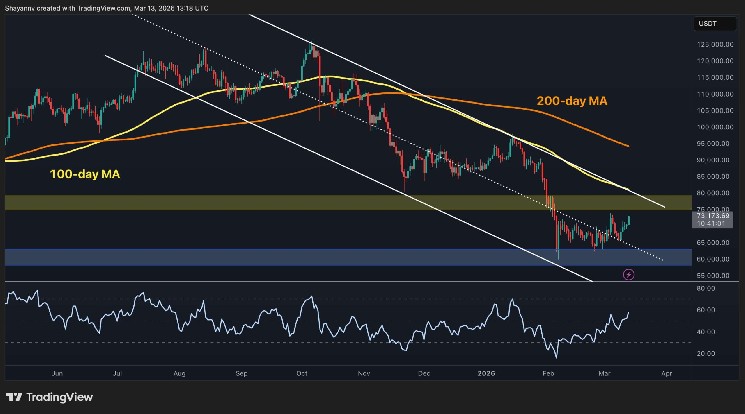
The daily chart is improving, but not completely bullish yet. $BTC managed to rise from the blue demand area around $60,000 to $62,000 and is now moving towards the old breakdown area around $75,000 to $80,000. This is an important development as this yellow zone served as support before the market lost it during a broader downtrend. Reaching it again indicates that the buyer has regained some control, but taking it back is another matter entirely.
The broader structure still requires attention. The price is still below the declining 100-day moving average and 200-day moving average, both of which are still trending downward. This means that the macro trend has not yet been repaired. In other words, $BTC It has risen to overhead supply while remaining below the main trend filter. If buyers can force acceptance beyond the $75,000 region each day, the technical situation will improve significantly. Otherwise, this remains a rebound within a larger correction phase.

$BTC/USDT 4 hour chart
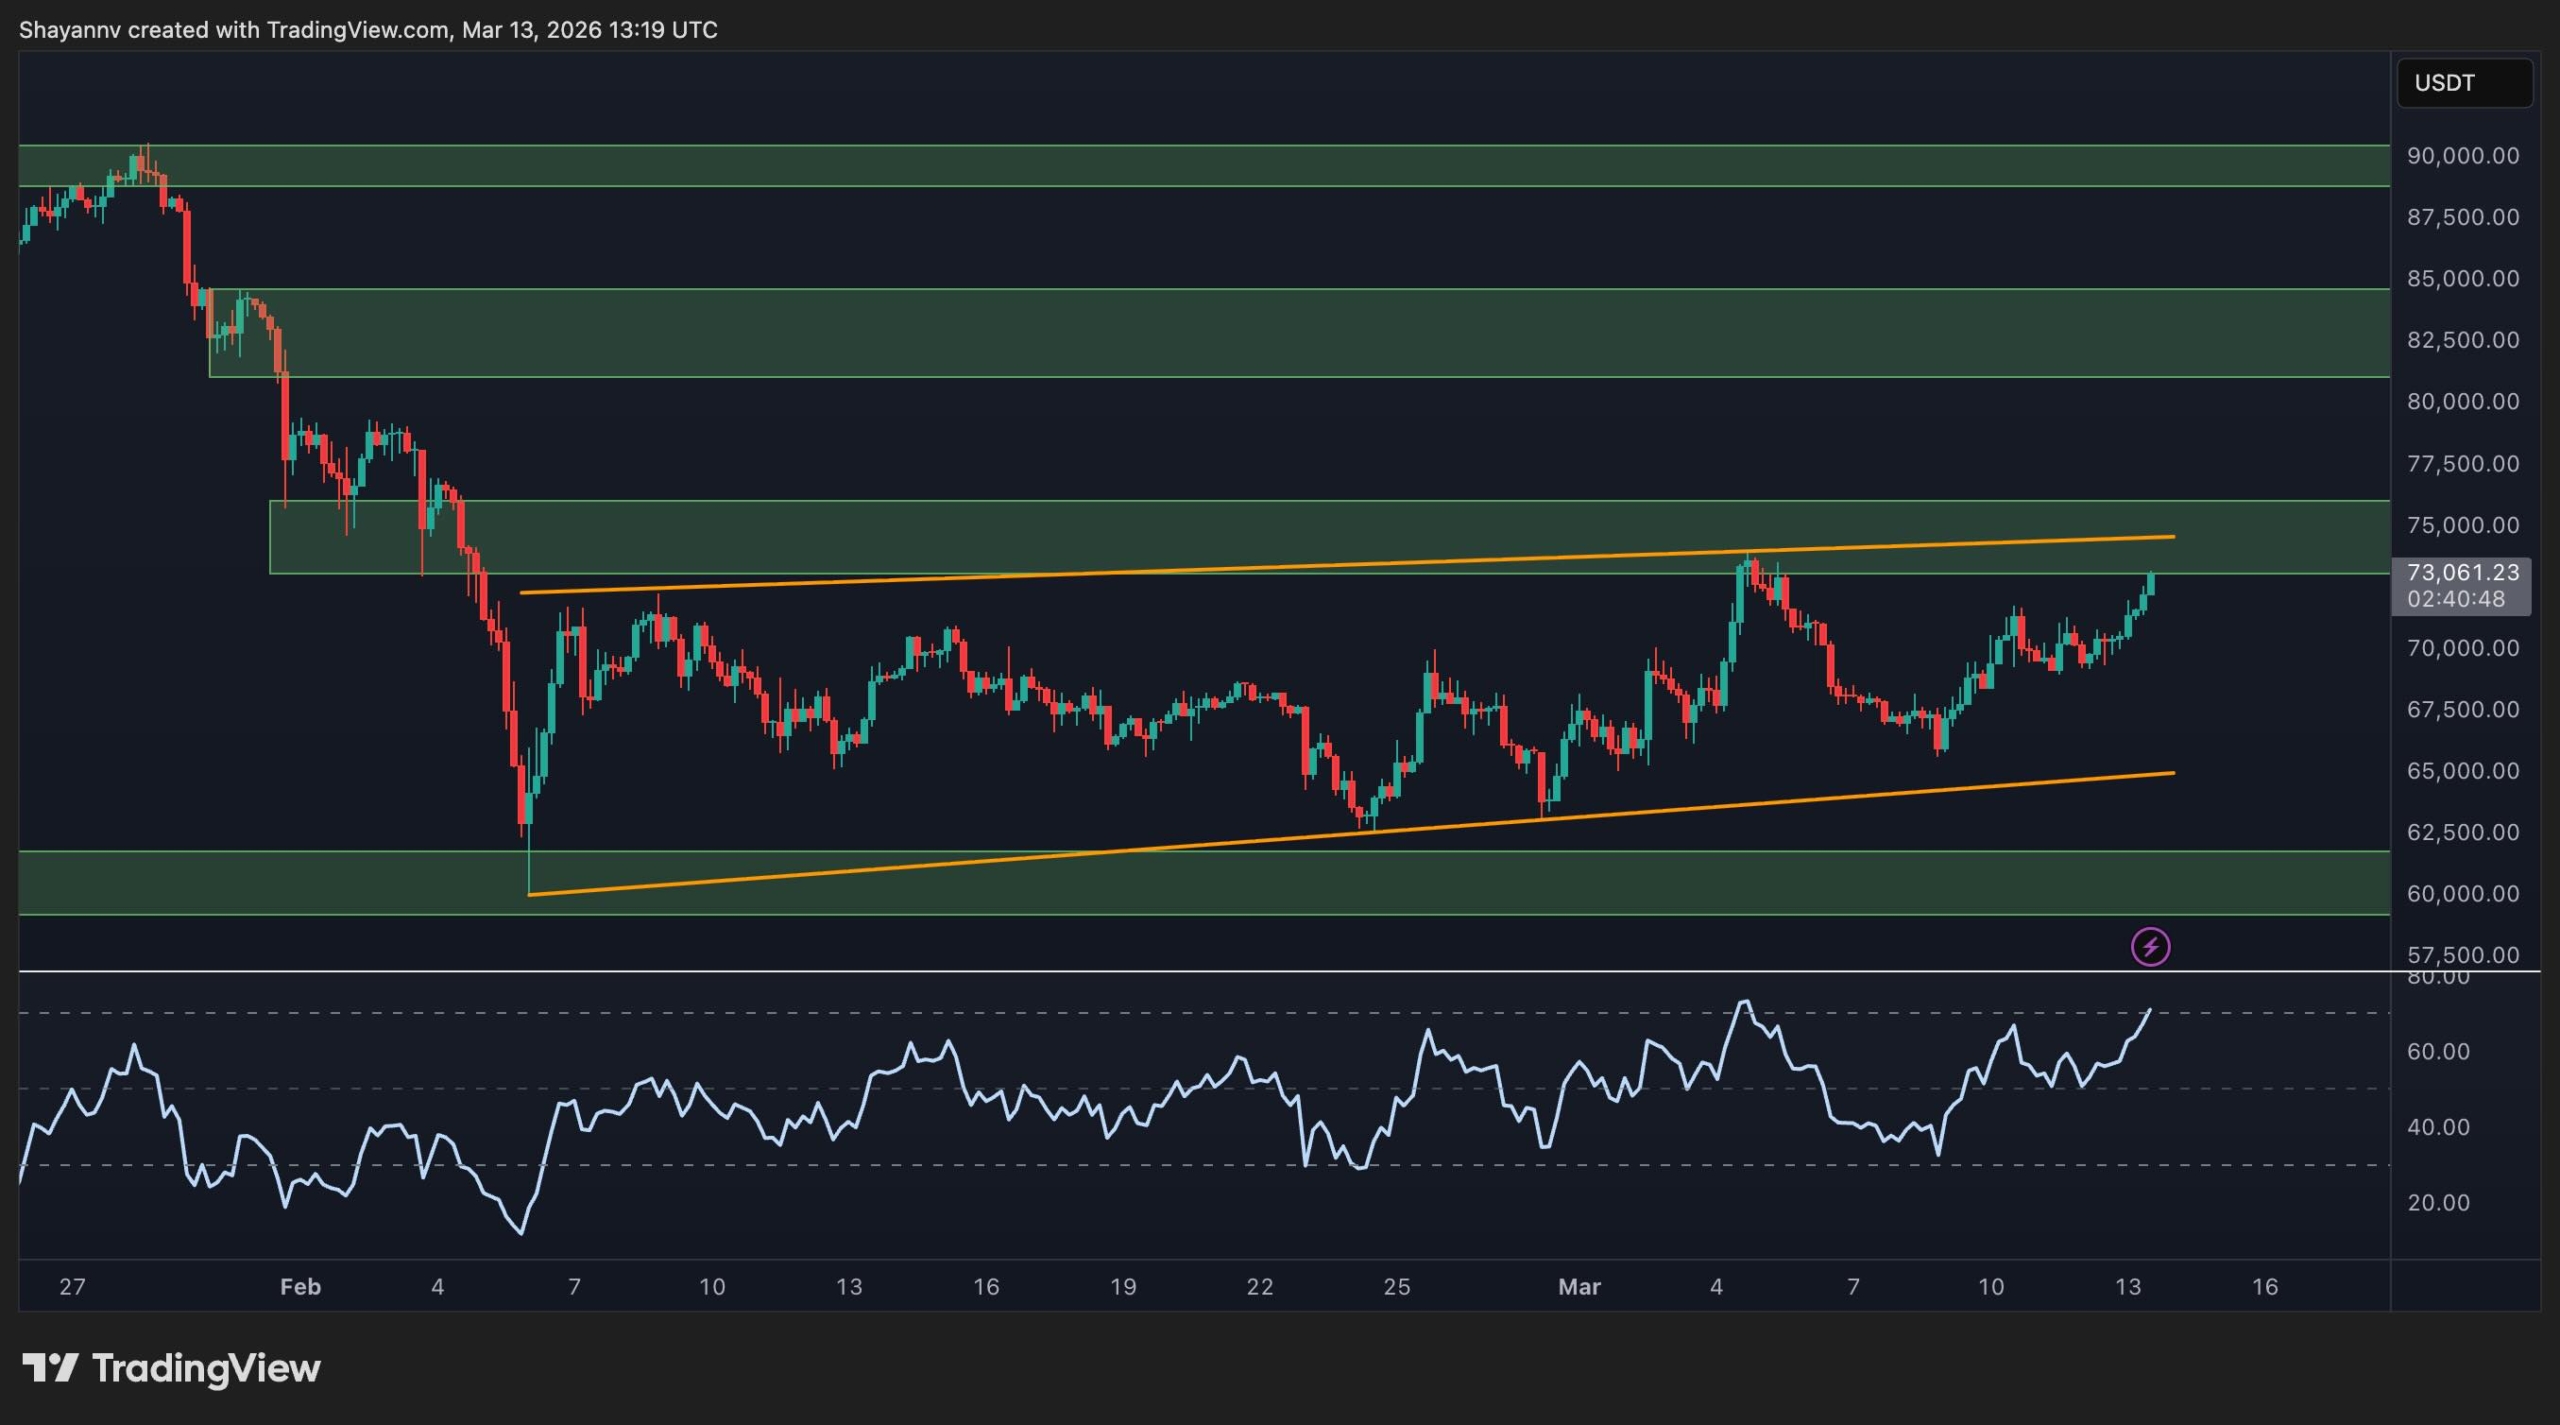
On the 4-hour chart, the recovery looks much nicer. Bitcoin has been forming a bullish structure with higher lows, and the recent rally has pushed the price back towards the upper end of that formation. The market is no longer trending up. It is an aggressively pressurizing resistance that typically precedes either a breakout or a sharp reaction.
Momentum supports the idea of short-term strength, with the RSI rising to the upper end of the range. Still, it also means $BTC It has already gained momentum and reached resistance. Therefore, your next move will be important. A clean break above the channel top and the $73,000 to $75,000 supply band would suggest a continuation into the next overhead zone. On the other hand, if it is rejected here, the price will likely return to the mid-range and the market will likely be locked in consolidation for even longer.
On-chain analysis
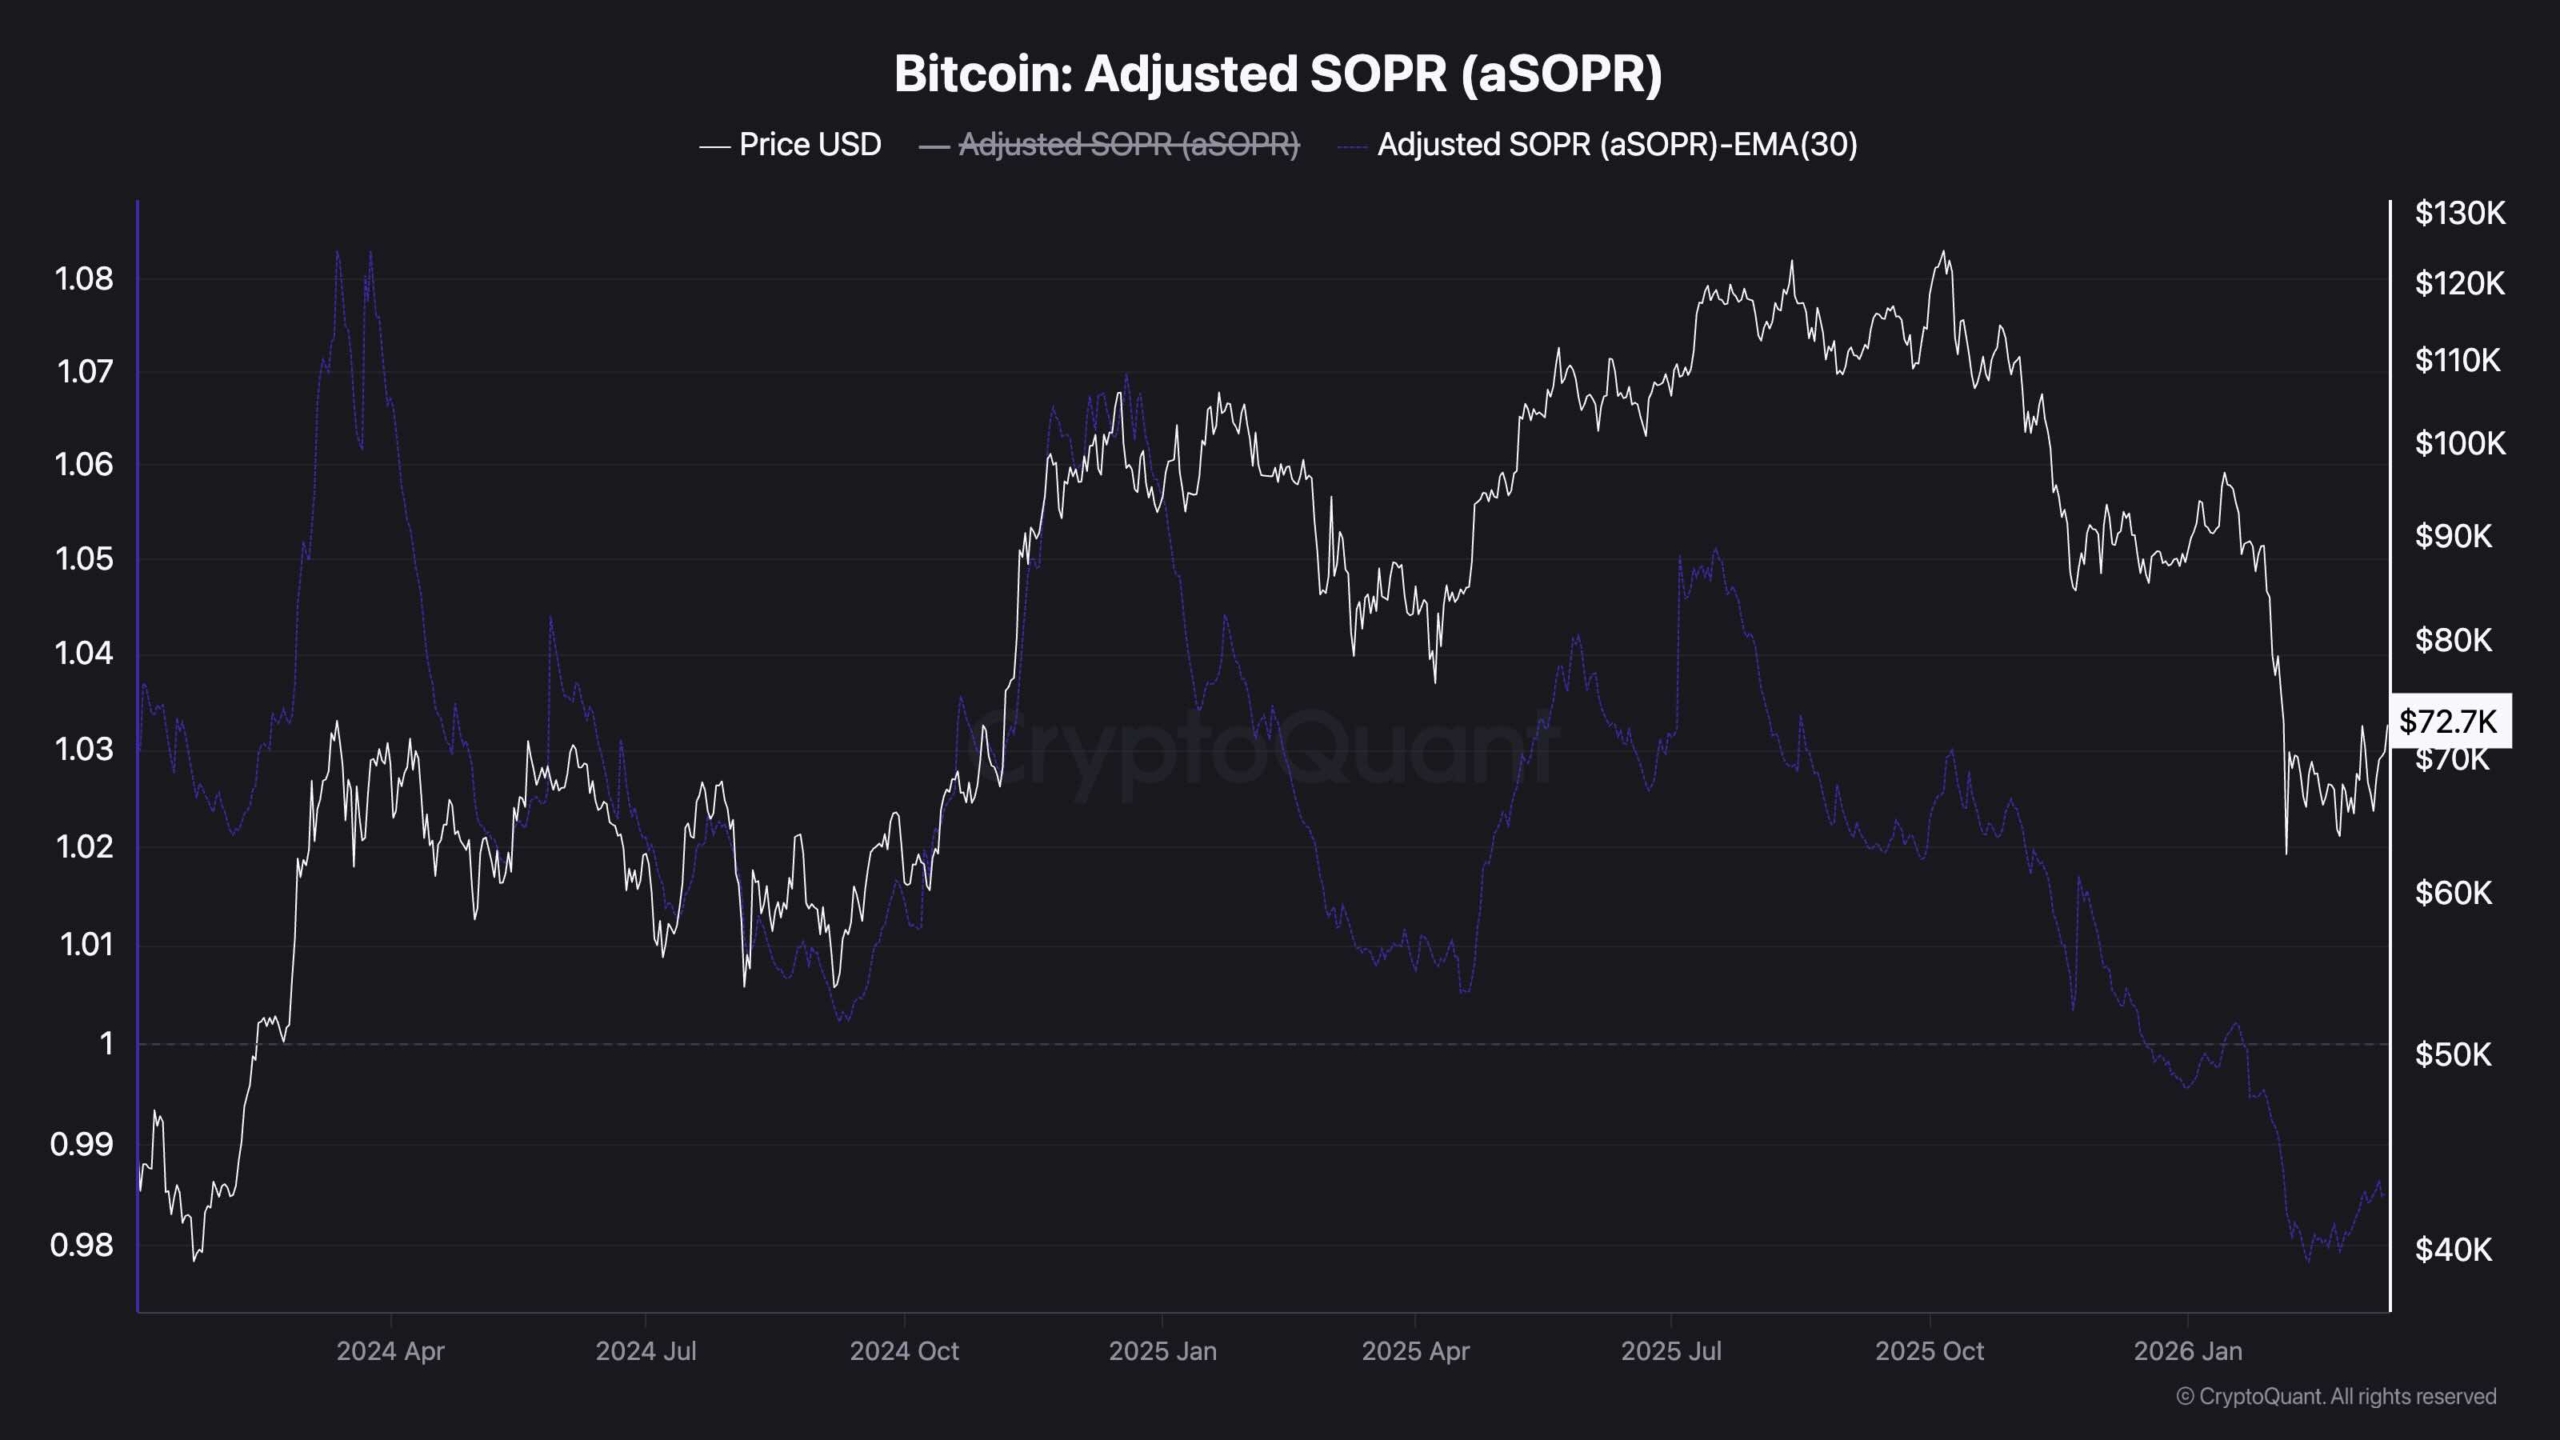
The on-chain background adds an interesting twist. Bitcoin’s adjusted SOPR remains below 1, meaning that coins moving on-chain are still being spent in the red on average. These situations tend to occur during corrections or transition stages, where markets have not yet fully returned to profit-taking behavior. Therefore, despite the recent price recovery, network data suggests that the widespread reset is far from over.
At the same time, aSOPR has begun to recover from recent lows, an early sign of improving conditions. While this in itself does not confirm a new expansionary phase, it does suggest that the worst of the yield pressure may already be behind the market. In other words, while price is testing resistance, on-chain behavior is trying to recover. If these two start to align through a confirmed breakout on the charts and a rise above 1 in aSOPR, the outlook for Bitcoin will become much stronger.