
Ethereum faces sustained selling pressure as weak demand increases the risk of liquidity being wiped out before any attempt at a rebound emerges.
Ethereum ($ETH) is trading at $1,828, a decline of 2.87% in the past 24 hours. The intraday chart shows that $ETH Initially trading above the $1,900 level, it faced sustained selling pressure and the price action fell into a steady downtrend.
After breaking below the $1,880 area, bearish momentum accelerated and led to session lows near the $1,820 area. Prices have since attempted to stabilize slightly, but remain in negative territory, reflecting the continued short-term slump.
Meanwhile, derivatives and volume data highlight increased market activity. 24-hour futures volume was $51.19 billion, significantly higher than spot volume of $3.38 billion, suggesting leveraged trading continues to dominate market participants. Ethereum’s open interest is $23.38 billion, indicating that there are significant outstanding positions in derivatives despite the decline. can Ethereum Will we finally find the bottom?
Ethereum price prediction
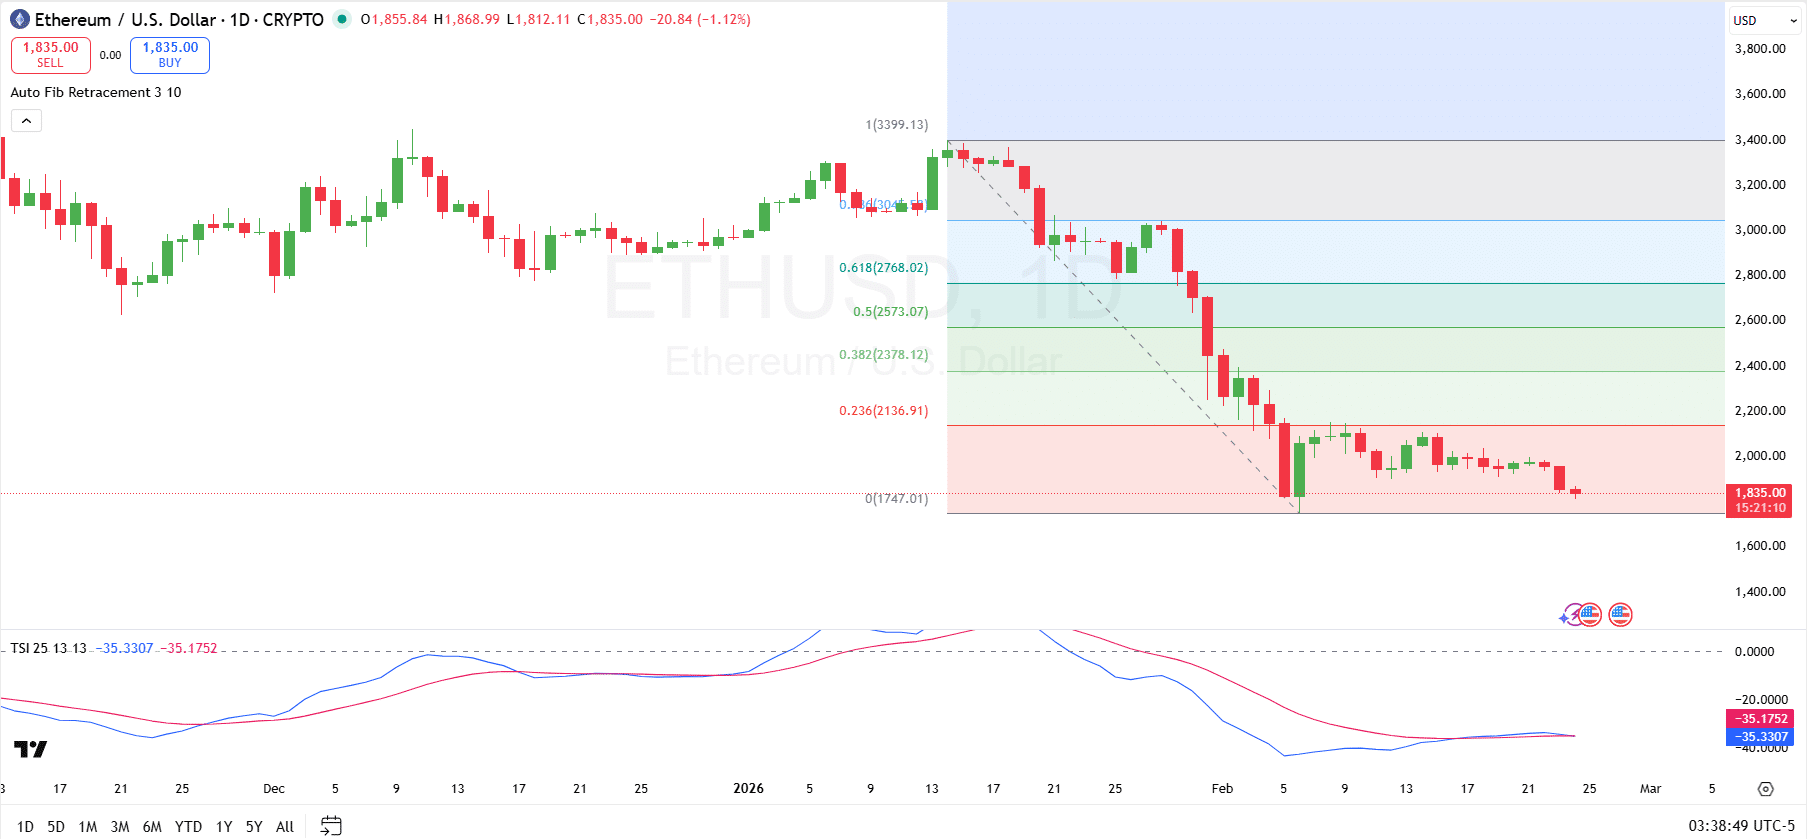
Looking at the daily chart, Ethereum is trading just below $1,900 after aggressively declining from recent highs near $3,399 in mid-January to lows near $1,747. The automatic Fibonacci retracement levels highlight how sharply the price has broken through key support zones since the swing high, including the 0.618 ($2,768), 0.5 ($2,573), 0.382 ($2,378), and even the 0.236 levels, confirming strong bearish momentum on the decline.
Ethereum 1D chart
The price is currently consolidating just above the swing low, but remains firmly below the 0.236 retracement near $2,136, which is currently a key resistance level. unless $ETH Even if we regain that level, the broader structure remains favorable to sellers, and the $1,747 swing low remains a key support zone to watch.
Momentum indicators support this cautious outlook. Specifically, the true strength index is still in negative territory, with both lines hovering around -35, indicating only a gradual flattening rather than a definitive bullish crossover. This indicator suggests that the downside momentum may be stabilizing after the sharp selloff, but does not confirm a reversal yet.
Ethereum buyers have not yet entered the market
In another social media comment, crypto analyst Ted said: memo How Ethereum fell towards the $1,800 level. He said buying pressure has not meaningfully intervened in this zone, suggesting the market may not have found a firm bottom yet.

Ethereum predictions
Without strong demand, you are more likely to: $ETH This month’s lows could be wiped out before any sustained recovery attempt begins. He added that after a possible sweep, Ethereum could see some rebound after reaching levels around $1,500.
On the chart, Ted also highlights key resistance zones that could determine the strength of the recovery. The first major barrier is near $2,097, followed by a broader area of resistance near $2,400 and a higher ceiling near $2,800.