
Ethereum price has rejected the $3,400 region as a daily bearish divergence forms and volume declines, increasing the likelihood of a corrective move towards the $2,800 high timeframe support.
summary
- Ethereum Rejected at $3,400 resistance at VAH + 0.618 confluence
- Daily bearish RSI divergence suggests weak momentum at highs
- As volume fades out, pullback odds towards $2,800 support increase
Ethereum (Ethereum) The recent price rally is showing early signs of depletion as the price fails to sustain above the key time frame high resistance zone of $3,400. meanwhile Ethereum While the market remains strong overall, the market is currently displaying technical warning signals, which often appear near local highs, especially when resistance coincides with weakening momentum.
Important technical points of Ethereum price
- ethereum rejected $3,400 resistancehigh confluence technical zone
- Ethereum Printing in progress daily bearish diversity Because RSI weakens despite high prices
- Due to the decrease in trading volume, $2,800 support
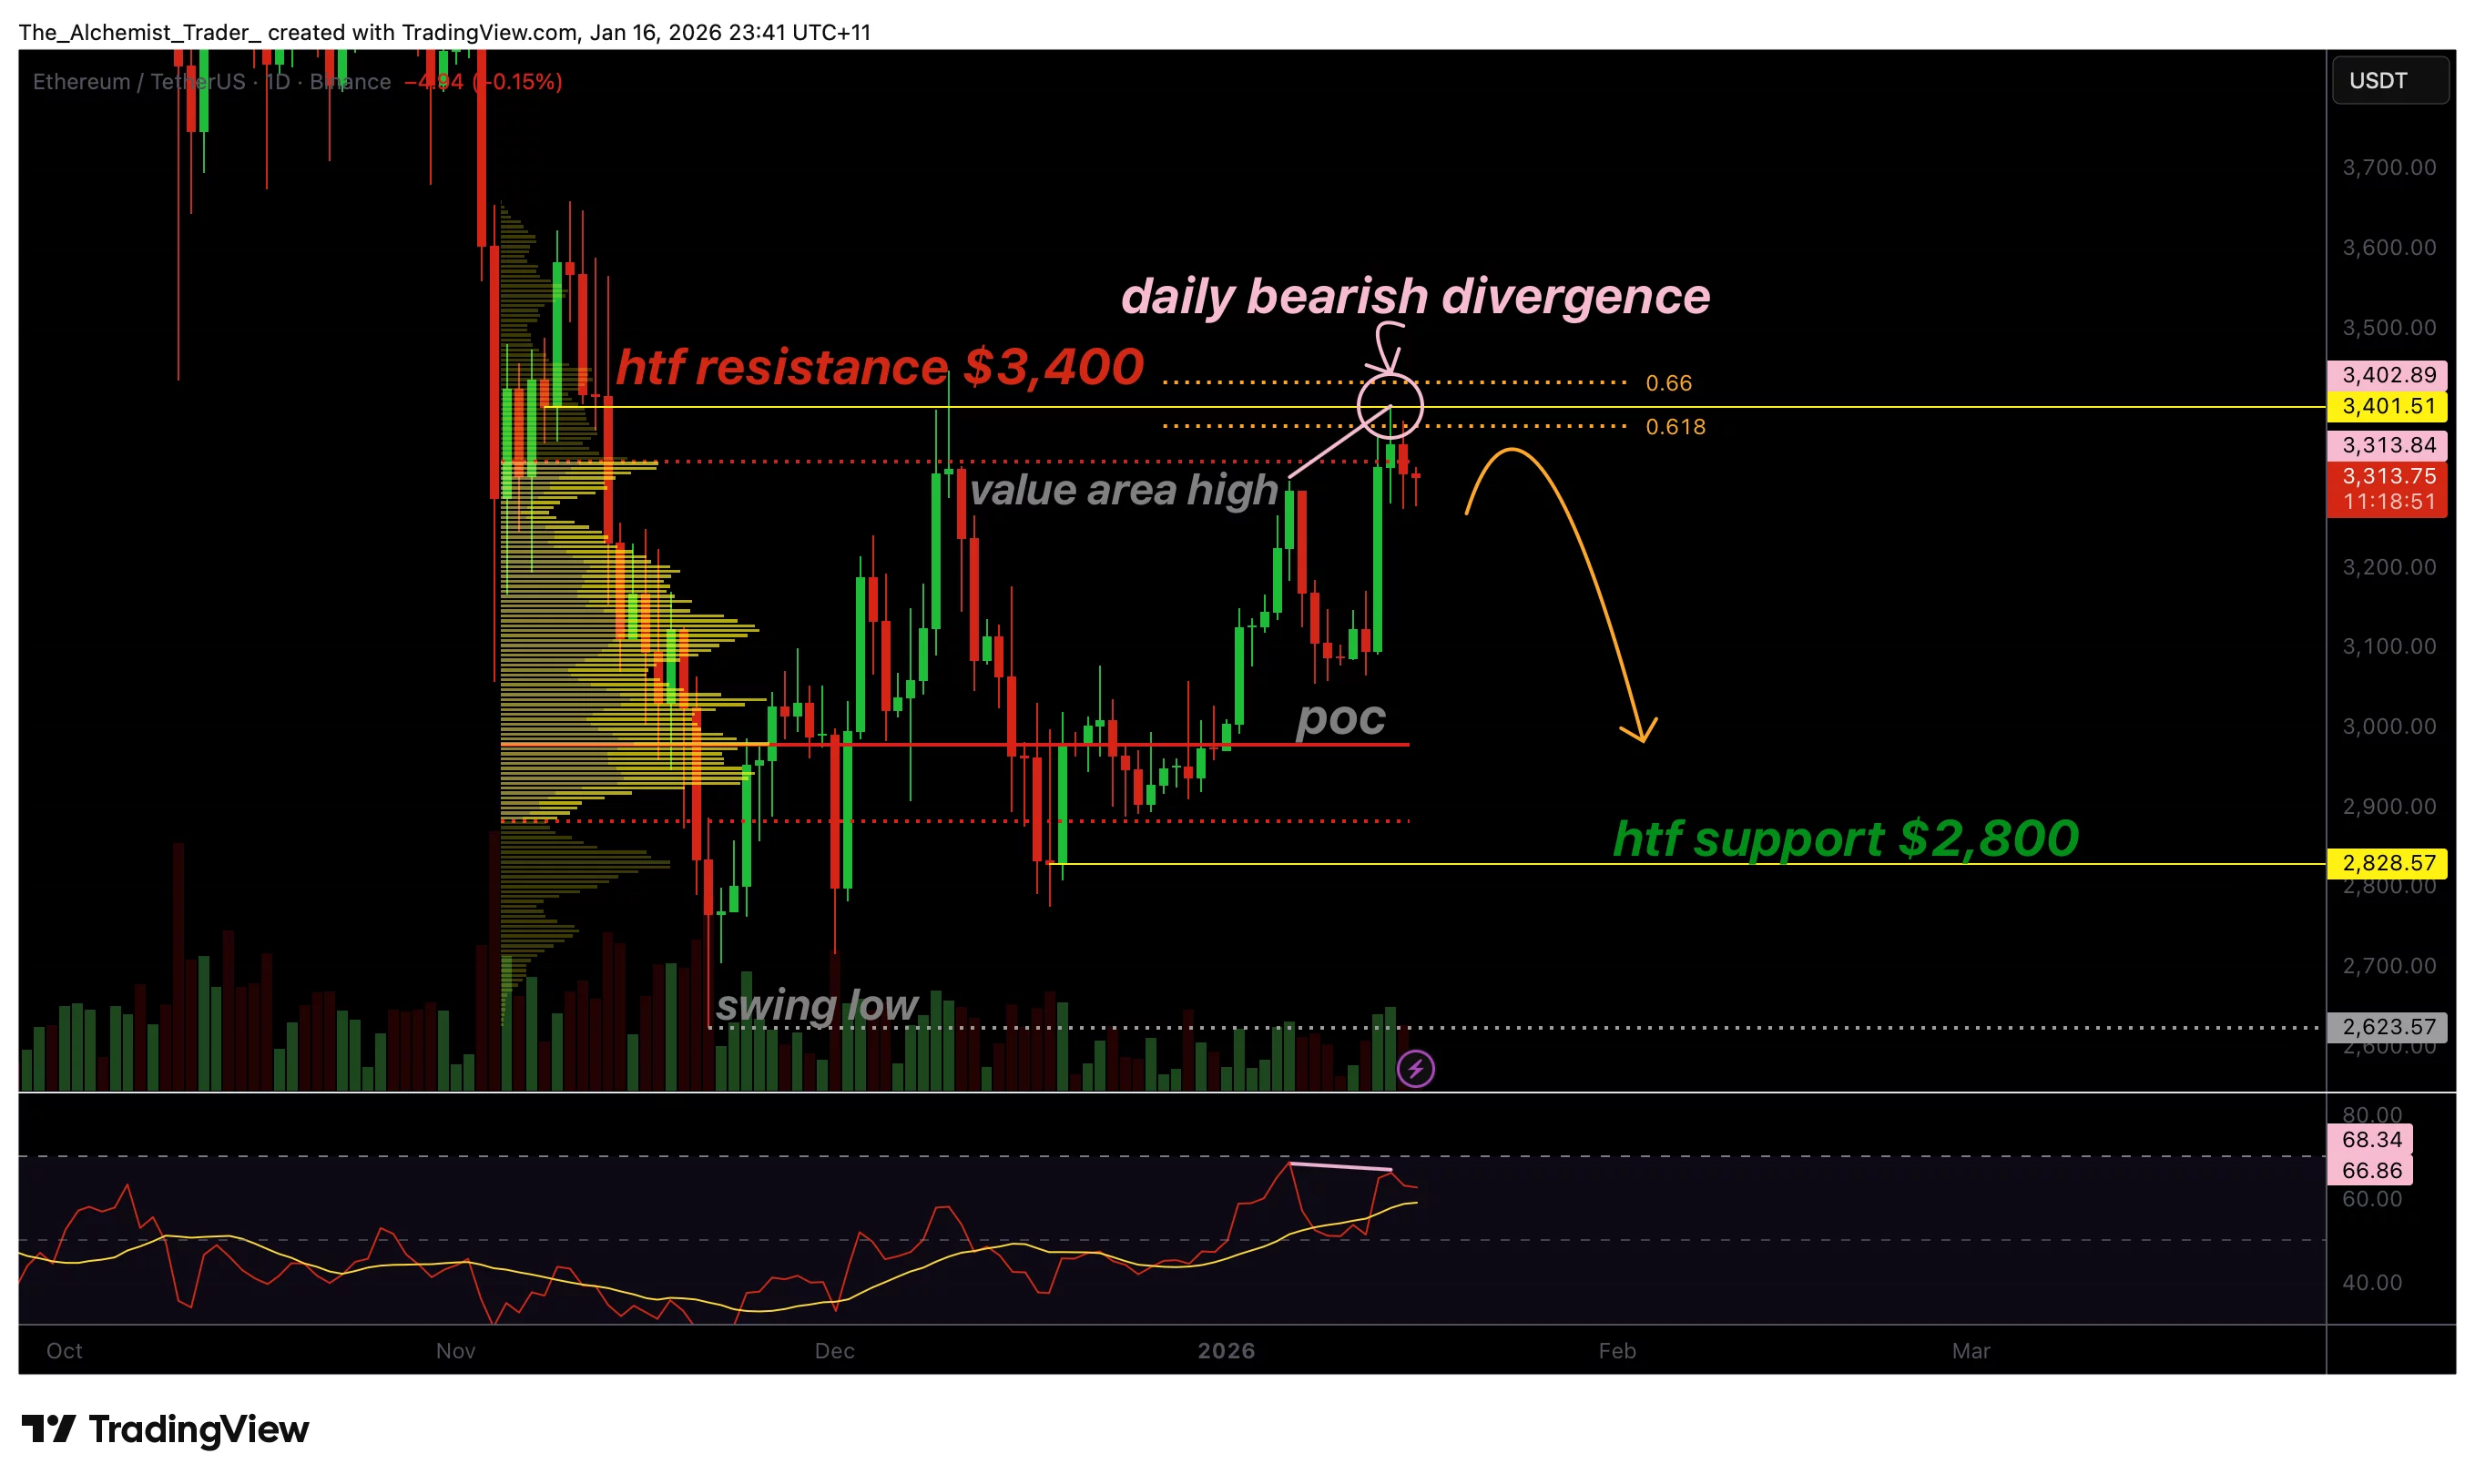
ETHUSDT (4H) chart, source: TradingView
The $3,400 area remains one of Ethereum’s most important structural resistance levels. Although the price was pushed into this zone with strong momentum, the market is now showing signs of rejection, indicating that sellers are actively defending the level.
This zone is enhanced by several technical factors. The high of the value area represents the upper limit of value allowed within the current range structure, meaning that the price is trading in a premium area where distribution is more likely to occur. At the same time, the 0.618 Fibonacci retracement adds an important decision level that separates continuations from reversals.
When Ethereum rejects this type of high confluence region, it typically shows one of two outcomes. Either a deeper consolidation before attempting another breakout, or the start of a correction back to lower range values.
You may also like: Bitcoin Academy founder Brian Sewell sentenced to 3 years in prison for $2.9 million cryptocurrency fraud
Daily bearish divergence suggests weakening momentum
The most notable signal on the chart is the daily bearish divergence. This divergence occurs when price records new highs while momentum indicators such as the RSI record lower highs. Simply put, Ethereum is driving up the price, but the momentum is fading.
This is important because the intraday divergence has more weight than the intraday signal. Higher timeframe divergences reflect broader market participation and often reveal when demand is weakening over multiple sessions, rather than just a temporary pause during the day.
Bearish divergences at resistance are often associated with upside action as they indicate buyers are struggling to match the strength of the price increase. Although prices may still try to move higher temporarily, this divergence suggests that the market will become increasingly vulnerable to a reversal if sellers start pushing lower.
Decrease in trading volume adds new risks
Volume behavior supports the top story. Ethereum’s rally is showing signs of declining participation, a common feature of weakening bull markets. Strong breakout conditions typically require higher volumes as buyers gain confidence and intervene aggressively to push the price above the resistance.
When volume declines during an uptrend, it often suggests that the movement is being driven by reduced selling pressure rather than strong demand. This creates an unstable structure that is sensitive to rejection when price hits resistance.
In Ethereum’s current setup, a rejection near $3,400, a bearish divergence on the daily chart, and declining volume combine to create a technical environment where reversal risk is increasingly difficult to ignore.
You may also like: Bitcoin bull market eyes cautious comeback as Matrixport says on-chain stress eases
Downside price target: $2,800 high timeframe support
If Ethereum continues to reject $3,400 and a bearish divergence develops, the next major technical objective will be the high timeframe support at $2,800. This zone represents the next important area of demand where buyers are likely to defend the price.
A move towards $2,800 would also be consistent with the typical price movement, where prices rotate from the highs of the value area towards lower support levels to rebalance and create liquidity. In this sense, this correction does not necessarily imply an outright macro bearish trend. Rather, it represents a healthy reset within the broader structure, especially if $2,800 holds as support.
However, if Ethereum fails to sustain the closing price of $2,800, the market could enter a deeper correction. Therefore, this level is an important axis for determining whether the pullback is temporary or more structural.
What to expect from future price trends
Ethereum may remain sensitive near the $3,400 resistance zone in the short term. If price continues to reject and the bearish divergence remains active, the odds are likely to pull back towards the $2,800 support, especially if volume continues to decline.
A bullish continuation scenario would require Ethereum to recover $3,400 with strong volume and multiple closes above resistance levels to neutralize the divergence signal. But until that happens, technical evidence supports increased reversal risk.
read more: Foreign exchanges face Google Play lockout under South Korean VASP rules